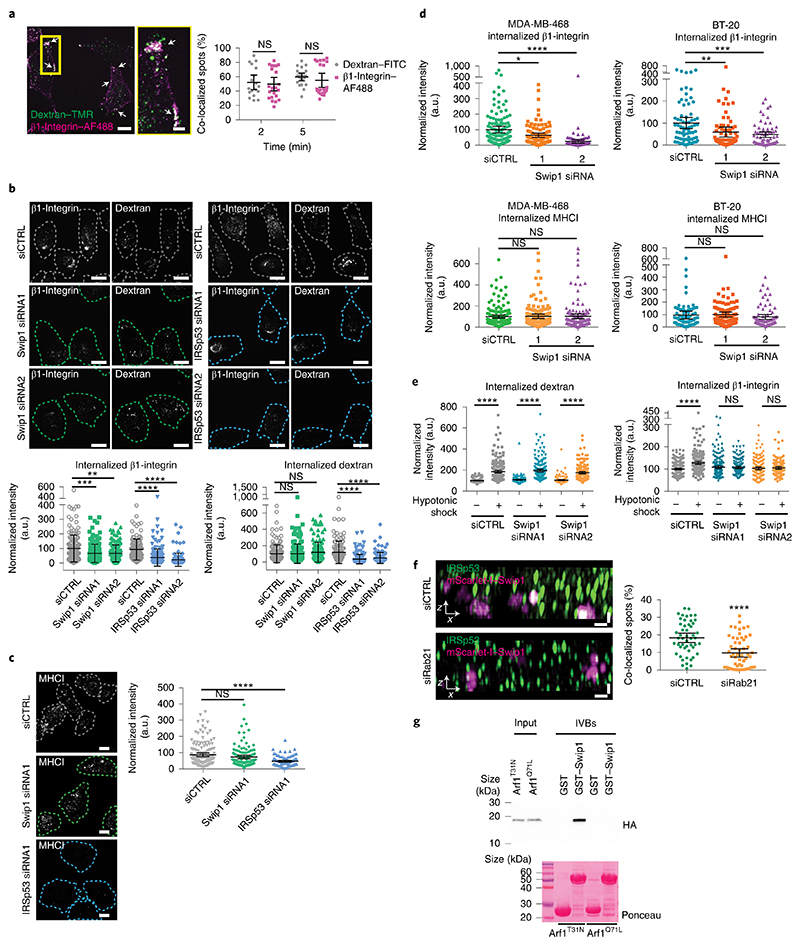
Fig. 5. Swip1 is a cargo adaptor for the CG pathway.
a, Double uptake (indicated by arrows) of fluorescently labelled 10 kDa dextran–tetramethylrhodamine (TMR) with either fluorescein isothiocyanate (FITC)-conjugated dextran or Alexa Fluor (AF) 488-conjugated anti-β1-integrin antibody (12G10, β1-integrin–AF488) in MDA-MB-231 cells for the indicated times (right). Representative images at 5 min internalization are shown (left). Scale bars, 10 μm (main image) and 3 μm (inset, magnified view of the yellow box in the main image). Dextran–FITC, n = 18 and 21 cells; and β1-integrin–A488, n = 22 and 21 cells. b, Representative micrographs (top), and levels of dextran–TMR (bottom right) and β1-integrin–AF488 (bottom left) internalization in control-, Swip1- and IRSp53-silenced MDA-MB-231 at 15 min. Swip1 siRNA1, n = 157 cells; Swip1 siRNA2 and siCTRL, n = 160 cells; siCTRL, n = 121 cells; IRSp53 siRNA1, n = 177 cells; and IRSp53 siRNA2, n = 121 cells. ***P = 0.0001 and **P = 0.0004. c, Representative micrographs (left) and levels of MHCI internalization in control-, Swip1- and IRSp53-silenced MDA-MB-231 at 15 min (right). Swip1 siRNA1, n = 125 cells; IRSp53 siRNA1, n = 92 cells; and siCTRL, n = 152 cells. b,c, Dashed lines show the outlines of the cells defined by labelling with the plasma membrane marker WGA lectin conjugated to Alexa Fluor 647 (WGA–AF647). Scale bars, 10 μm. d, Levels of β1-integrin (top) and MHCI (bottom) internalization in control- or Swip1-silenced MDA-MB-468 (left) and BT-20 (right) cells at 15 min. For BT-20 12G10 and MHCI uptake, respectively, siCTRL, n = 79 and 91 cells; Swip1 siRNA1, n = 76 and 91 cells; and Swip1 siRNA2, n = 66 and 75 cells. For MDA-MB-468 12G10 and MHCI uptake, respectively, siCTRL, n = 134 and 155 cells; Swip1 siRNA1, n = 98 cells and 156 cells; and Swip1 siRNA2, n = 98 cells and 135 cells. *P = 0.0137, **P = 0.0007 and ***P = 0.0006. e, Levels of β1-integrin–AF488 (right) and 10 kDa dextran–TMR (left) uptake in steady state or after recovery from hypotonic shock in control- and Swip1-silenced MDA-MB-231 cells. For dextran uptake in the absence of (−) or with (+) hypotonic shock, respectively: siCTRL, n = 227 and 220 cells; Swip1 siRNA1, n = 208 and 186 cells; and Swip1 siRNA2, n = 208 and 187 cells. For β1-integrin uptake in the absence of (−) or with (+) hypotonic shock, respectively: siCTRL, n = 195 and 191 cells; Swip1 siRNA1, n = 208 and 181 cells; and Swip1 siRNA2, n = 181 and 139 cells. f, SIM x–z projections of control- and Rab21-silenced (siRab21) MDA-MB-231 cells expressing mScarlet-I–Swip1 and immunostained for IRSp53 (left). Co-localization between mScarlet-I–Swip1 and endogenous IRSp53 was quantified (right); siCTRL, n = 50 cells; and siRab21, n = 56 cells. Scale bars, 0.5 μm. g, Cell lysates from HEK293T cells transfected with HA–Arf1T31N (inactive) or HA–Arf1Q71L (active) were incubated with 2 μM of recombinant purified GST or GST–Swip1. Representative GST pulldowns (IVBs) stained with Ponceau and blotted with the indicated antibody from three independent experiments. a–f, Data are the mean ± 95% CI; n is the total number of cells pooled from three independent experiments. Statistical significance was assessed using two-sided Mann–Whitney tests; ****P < 0.0001. Unprocessed blots and numerical source data are provided.

