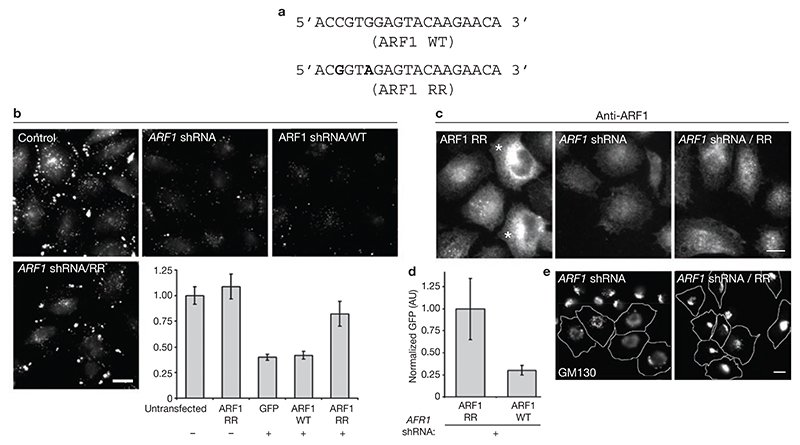
Figure 3. RNAi-resistant ARF1 reverts shRNA-mediated inhibition of the GEEC pathway.
(a) Silent nucleotide substitutions in primers employed to create ARF1 RNAi-resistant (RR) form are highlighted in bold-type, with respect to positions in wild-type (WT) ARF1. (b) IA2.2 cells transfected with ARF1 RR–GFP (control), ARF1 shRNA alone, or ARF1 shRNA and ARF1 WT–GFP (ARF1 shRNA/WT), or ARF1 shRNA and ARF1 RR–GFP (ARF1 shRNA/RR), were assessed for endocytosis of the fluid phase 60 h post-transfection. The histogram shows the quantification of fluid uptake in the indicated GFP-expressing cells. The error bars represent weighted mean, normalized to untransfected (control) cells, ± s.e.m.(n = 89, 81, 109, 84, 97). This experiment was repeated twice with similar results. (c) Cells transfected with indicated expression vectors for 60 h were fixed and processed for immunofluorescence microscopy to detect ARF1 levels. ARF1 RR–GFP overexpressing cells are marked with an asterisk. Note that coexpression of ARF1 RR–GFP with shRNA restores the ARF1-antibody staining levels comparable to unmarked cells in ARF1 RR panel. (d) Histogram representing the average GFP-fluorescence intensity in cells cotransfected with ARF1 shRNA together with ARF1 WT–GFP or ARF1 RR–-GFP, normalized to GFP fluorescence levels in ARF1 RR–GFP transfected cells. The error bars represent weighted mean of GFP intensities detected in individual cells (arbitrary units, AU) ± s.e.m.(n = 120, 91). This experiment was repeated twice with similar results. (e) Overexpression of ARF1 RR–GFP in ARF1 shRNA transfected cells restores typical Golgi morphology as assessed by monitoring GM130 antibody staining pattern. Approximately 70% of cells transfected with ARF1 shRNA exhibited a disrupted Golgi pattern. Note GM130 staining in the shRNA-expressing outlined cell versus surrounding untransfected cells. In contrast, only approximately 30% of cells exhibit this phenotype in cells cotransfected with ARF1 RR–GFP (n ≥80). The scale bars in b, c and e represent 10 μm.

