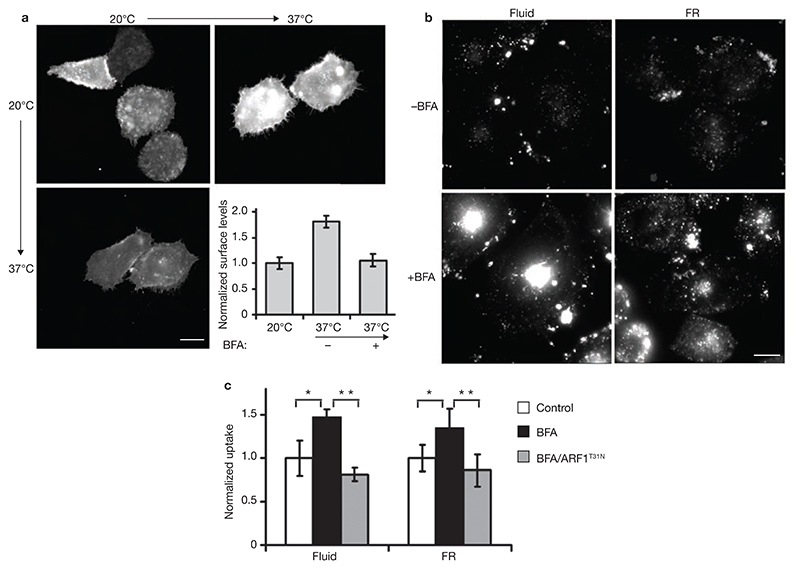
Figure 4. Brefeldin A inhibits surface delivery of GPI-APs, but enhances endocytosis via the GEEC pathway.
(a) CHO cells transiently transfected with CFP–GPI were grown at 20 °C for 16 h and then shifted to 37 °C in presence (+BFA, 20 μg ml–1) or absence of Brefeldin A (–BFA) for 1 h. Surface levels of CFP–GPI, monitored by labelling cells with anti-CFP at 4 °C, shows that BFA-treatment blocks exocytic delivery of CFP–GPI. The histogram shows anti-CFP antibody fluorescence at the surface of cells, normalized to total CFP–GPI expression per cell, and plotted as a ratio to the cell surface levels measured at 20 °C. The error bars represent weighted mean ± s.e.m. (n = 56, 40, 55). (b) IA2.2 cells, treated with BFA (20 μg ml–1 for 1 h at 37 °C) were assayed for FR–GPI and the fluid-phase uptake as described in Fig. 1. In BFA-treated cells, fluid-phase and FR–GPI uptake is enhanced. (c) Histogram showing quantification of fluorescence of endocytosed probes (normalized to FR–GPI expression at the surface for FR-GPI uptake) in cells treated with BFA in the presence or absence of ARF1T31N transfection, represented as the ratio of uptake to that observed in untreated cells (control). The error bars represents weighted mean ± s.e.m. (n = 98, 139, 71 for fluid and 103, 112, 64 for FR). The single and double asterisks represent P values (<0.002) from the indicated comparisons. The scale bars in a and b represent 10 μm.

