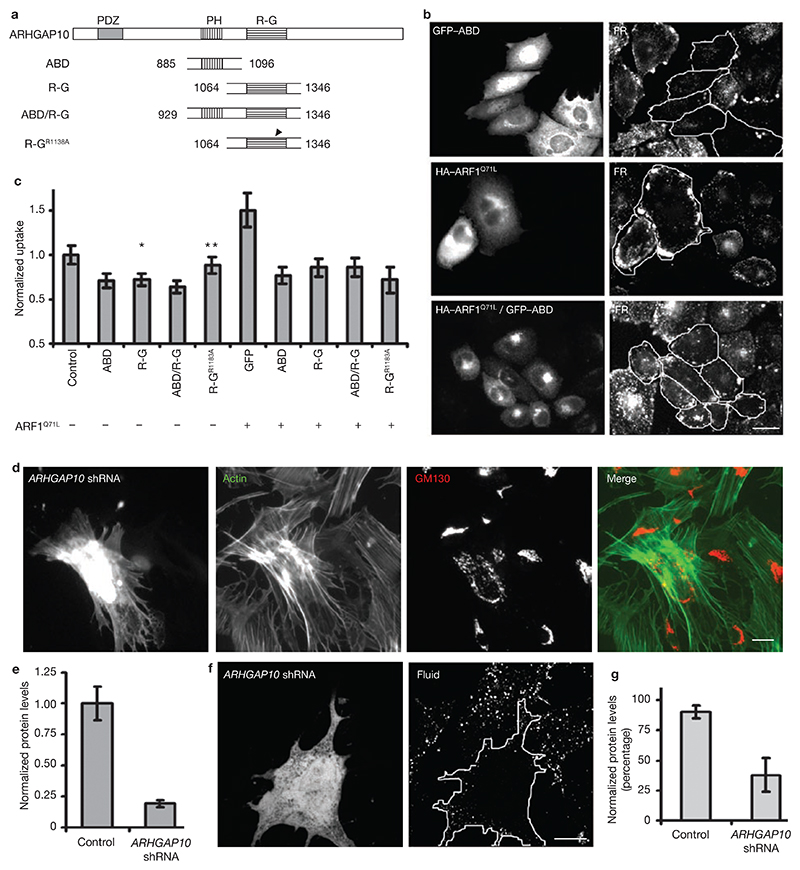
Figure 5. ARF1 functions via ARHGAP10.
(a) Deletion constructs of ARHGAP10 with different domains. ARF binding domain, ABD; RhoGAP domain, R-G; ABD and R-G domain, ABD/R-G; R-G domain mutated for GAP activity, R-GR1183A. (b) IA2.2 cells transfected with either singly with GFP–ABD, HA–ARF1Q71L or with both constructs were assayed for endocytosis of FR–GPI. Expression of GFP–ABD reduces, whereas ARF1Q71L expression enhances FR–GPI uptake. Endocytosed FR–GPI is more peripherally distributed in ARF1Q71L-expressing cells. Coexpression of both proteins (outlined cells) shows that GFP–ABD expression antagonizes ARF1Q71L-mediated endocytic enhancement. (c) Histogram showing quantification of internalized FR–GPI in cells expressing the indicated combination of constructs, normalized to that measured in GFP-transfected cells. The error bars represent weighted mean ± s.e.m. (n = 66, 49, 54, 57, 50, 50, 44, 56, 49). The single asterisk and the double asterisk represent P values ≤0.01, and 0.2, respectively. (d) MEFs transfected with ARHGAP10 shRNA for 72 h were fixed and stained for actin organization and Golgi morphology (GM130). Note that in transfected cells, the actin distribution is altered and Golgi is dispersed. This F-actin reorganization is observed in approximately 30% of transfected cells and change in Golgi morphology is observed in approximately 60% cells. (e) Histogram showing levels of anti-V5 antibody staining in V5-tagged ARHGAP10 N-terminal domain coexpressed with eGFP-N1 (control) or ARHGAP10 shRNA in CHO cells. The error bars represent weighted mean of average of V5 intensities per cell ± s.e.m. (n = 97, 82). (f) MEFs expressing ARHGAP10 shRNA (outlined, green in merge) exhibit a reduction in fluid-phase uptake (outlined, right panel) compared with surrounding untransfected cells. Images are single confocal plane representing either transfection marker or internalized fluid. (g) Histogram showing the percentage of cells (MEFs) that exhibit a normal fluid-phase uptake in cells expressing GFP alone (control) or ARHGAP10 shRNA, when compared to untransfected cells. The error bars represent average of data from three independent experiments ± s.d. (n = 35, 56). The scale bars represent 20 μm.

