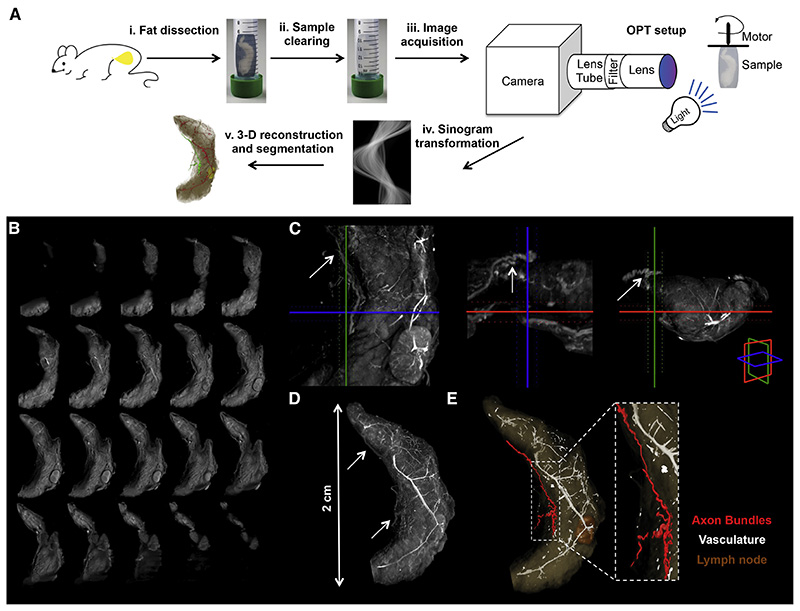
Figure 2. Neural Projections in Fat Detected with Optical Projection Tomography.
(A) Schematic representation of the OPT method applied to the subcutaneous inguinal fat. (i) Tissue dissection. (ii) Sample clearing. (iii) Image acquisition. (iv) Sinogram transformation. (v) 3-D reconstruction and segmentation. (B) OPT series of coronal sections of inguinal fat organ after 3-D reconstruction. (C) Orthogonal 400 μm OPT-slabs of inguinal fat in coronal, axial and sagittal view. Axon budles were identified based on the grey threshold level (arrows). (D) 3-D reconstruction in maximal intensity projection of the OPT coronal sections. (E) Surface view of segmented structures within inguinal fat.

