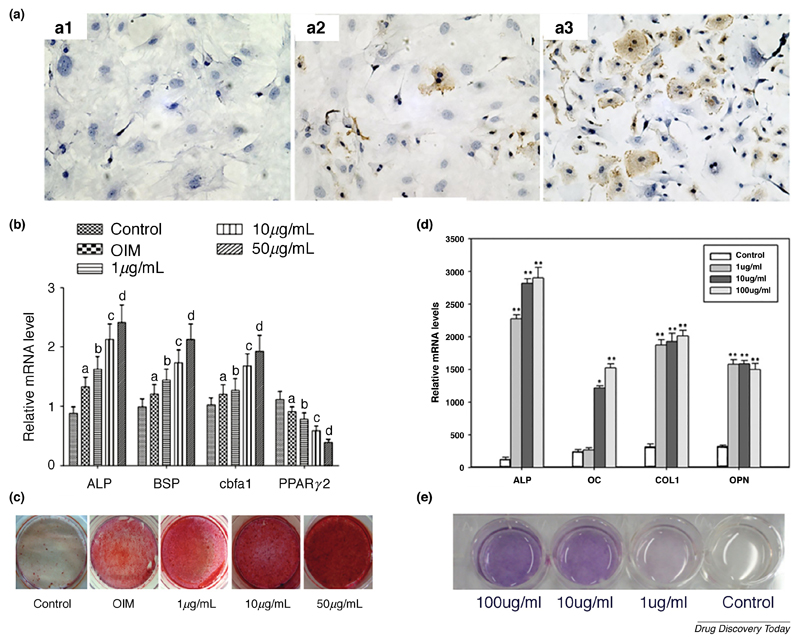
Figure 2.
Naringin increases the expression of osteogenic markers, leading to an enhanced mineralization. (A) OC immunostaining of rat BM-MSCs after induction with different naringin doses for 6 days, A1 – control, A2 – 1 µg/mL, A3 – 10 µg/mL. (B) RT-PCR gene expression analysis of osteogenic markers after a 14-day treatment of rat BM-MSCs with different naringin doses. Data is represented in mean ± s.d. (n=5). ap < 0.05 versus control group; bp < 0.05 versus the OIM group; cp < 0.01 versus the 1 µg/mL group; dp < 0.01 versus the 10 µg/mL. (C) Alizarin Red S staining of calcium deposits formed in rat BM-MSCs after incubation with various doses of naringin (1, 10 and 50 µg/mL) for 21 days. (D) RT-PCR gene expression analysis of osteogenic markers after a 7-day treatment of human BM-MSCs with different naringin doses. Data represented in mean ± s.d. (n=6). *p < 0.05 and **p < 0.01 compared with the control group (n=6). (E) ALP staining of human BM-MSCs 7 days after drug administration. Adapted from references [25,29] with permission from Elsevier. Reference [26] adapted under a Creative Commons Attribution 4.0 International license (https://creativecommons.org/licenses/by/4.0/).

