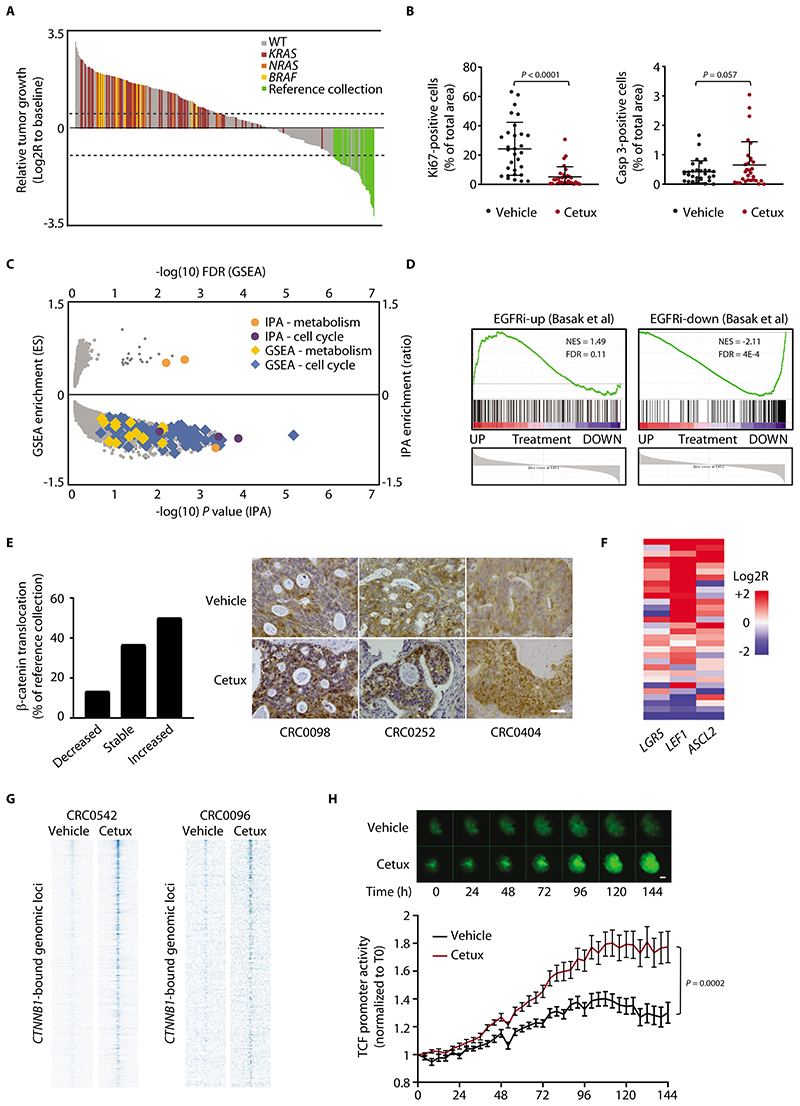
Figure 1. Residual tumors after EGFR blockade are made of slowly cycling cells with high Wnt signaling.
(A) Waterfall plot of response after 3 weeks of treatment with cetuximab (20 mg/kg, intraperitoneal injection twice a week), compared with tumor volume at baseline, in a population of 279 PDX models (n = 6 or 12 mice for each bar, depending on whether initial engraftment was successful in one or two mice). Dotted lines indicate the cut-off values for arbitrarily defined categories of therapy response (16): regression (below the lower line, -50%), progressive disease (above the upper line, +35%), and stabilization (between the lines). WT represents cases with no mutations in KRAS, NRAS, or BRAF. Reference collection represents responder cases selected for characterization of residual disease (all wild-type for KRAS, NRAS, and BRAF). (B) Morphometric quantification of proliferation (left panel) and apoptosis (right panel) in PDXs from the reference collection after treatment with vehicle (until tumors reached an average volume of 1500 mm3) or cetuximab (for 6 weeks). Each dot represents the average of 10 optical fields (Ki67, 40X) or 5 optical fields (caspase 3, 20X) in a section from randomly chosen tumors from vehicle-treated and cetuximab-treated mice bearing a PDX from the same original patient (n = 30). The plots show means ± SD. Statistical analysis by two-tailed paired Student’s t-test. Casp, caspase. Cetux, cetuximab. (C) Scatter plot showing GSEA and IPA results of differential gene expression profiles obtained by comparing PDXs treated with cetuximab with their matched vehicle-treated controls (GSE108277). Enrichments are plotted on the y axes, and their significance is plotted on the x axis. Gene sets related to cell cycle and metabolism are shown by the indicated colors. ES, enrichment score. (D) GSEA plots showing modulation of the EGFR inhibition signature in PDXs treated with cetuximab (GSE108277). EGFR inhibition signature was defined from LGR5+ normal intestinal cells (24). EGFRi-up, genes upregulated by EGFR inhibition; EGFRi-down, genes downregulated by EGFR inhibition; NES, normalized enrichment score; FDR, false discovery rate. (E) (Left) Qualitative morphometric assessment of the extent of nuclear β-catenin translocation in PDXs from the reference collection after treatment with cetuximab for 6 weeks, compared with vehicle-treated counterparts. (Right) Representative images in PDXs from the reference collection after treatment with vehicle or cetuximab. Scale bar, 50 μm. (F) Heatmap showing expression changes for the indicated Wnt target genes in PDXs of the reference collection after treatment with cetuximab for 6 weeks. Average gene expression, Log2R relative to vehicle-treated tumors: LGR5 0.46, P = 0.029; LEF1 1.98, P < 0.0001; ASCL2 0.61, P = 0.011 by two-tailed Wilcoxon test. Benjamini-Hochberg FDR < 0.1 for all genes. (G) Heat maps of ChIP-seq signal in the indicated tumors and experimental conditions at CTNNB1 (β-catenin)-enriched genomic loci +/-4kb to the peak center. (H) Longitudinal time-lapse monitoring of β-catenin transcriptional activity in CRC0078 colospheres transduced with a TOP-GFP lentiviral construct containing a TCF/LEF-responsive promoter. PuraMatrix-embedded colospheres were treated with vehicle or cetuximab (20 μg/ml) in EGF-deprived medium (EGF = 0.4 ng/ml) for 6 days. Upper panel, representative images (scale bar, 50 μm); lower panel, morphometric quantification of GFP fluorescence. Values are the means ± SEM from one experiment (n = 18 for vehicle-treated colospheres and 20 for cetuximab-treated colospheres). Statistical analysis by two-way ANOVA.

