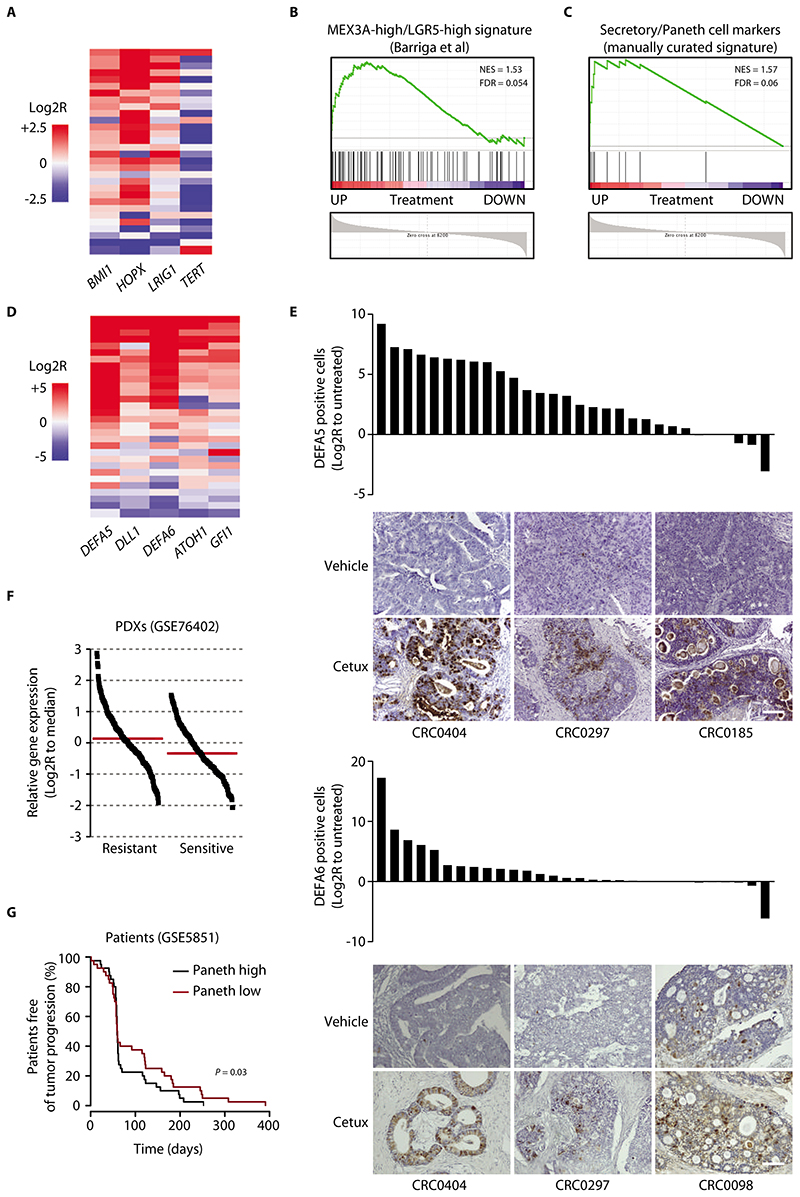
Figure 2. Cancer cells that withstand EGFR inhibition express markers of the Paneth cell lineage.
(A) Heatmap showing expression changes for the indicated LRC markers in PDXs of the reference collection after treatment with cetuximab (20 mg/kg, intraperitoneal injection twice a week for 6 weeks). Average gene expression, Log2R relative to vehicle-treated tumors: BMI1 0.57, P = 0.0002; HOPX 1.41, P < 0.0001; LRIG1 0.42, P = 0.006; TERT -1.41, P = 0.0071 by two-tailed Wilcoxon test. Benjamini-Hochberg FDR < 0.1 for all genes. (B) GSEA plot showing positive modulation of the MEX3A-high/LGR5-high signature (29) in PDXs treated with cetuximab (GSE108277). NES, normalized enrichment score; FDR, false discovery rate. (C) GSEA plot showing upregulation of a manually curated subset of secretory/Paneth cell genes in PDXs treated with cetuximab (GSE108277). (D) Heatmap showing expression changes for the indicated secretory/Paneth-cell markers in PDXs of the reference collection after treatment with cetuximab. Average gene expression, Log2R relative to vehicle-treated tumors: DEFA5 4.03, P < 0.0001; DLL1 1.12, P = 0.002; ATOH1 1.26, P < 0.0001; DEFA6 2.95, P = 0.0001; GFI1 1.04, P = 0.0006 by two-tailed Wilcoxon test. Benjamini-Hochberg FDR < 0.1 for all genes. (E) Morphometric quantification of DEFA5 and DEFA6 protein abundance changes in PDXs of the reference collection after treatment with cetuximab. Each bar represents the change of average protein abundance in 5 optical fields (20X) in a section from randomly chosen tumors from cetuximab-treated mice compared with a tumor from matched vehicle-treated mice (n = 5 for each bar). Representative images are also shown. P = 0.028 for DEFA5 and 0.0131 for DEFA6 by two-tailed paired Student’s t-test. Scale bar, 100 μm. Cetux, cetuximab. (F) Expression of secretory/Paneth cell markers in a dataset of mCRC PDXs annotated for response to cetuximab (GSE76402). Each dot represents the average expression of the secretory/Paneth cell signature metagene (ATOH1, GFI1, SOX9, XBP1, DEFA5, DEFA6, LYZ, SPINK4, DLL1, DLL4) in individual tumors. Log2R relative to the dataset median (red line). P < 0.0001 by two-tailed unpaired Student’s t-test. (G) PFS of patients with CRC metastases treated with cetuximab monotherapy (34), divided into two groups using the median signal intensity of the secretory/Paneth cell signature metagene as a cutoff (n = 40 patients with high signature and 40 patients with low signature). Statistical analysis by Cox regression.

