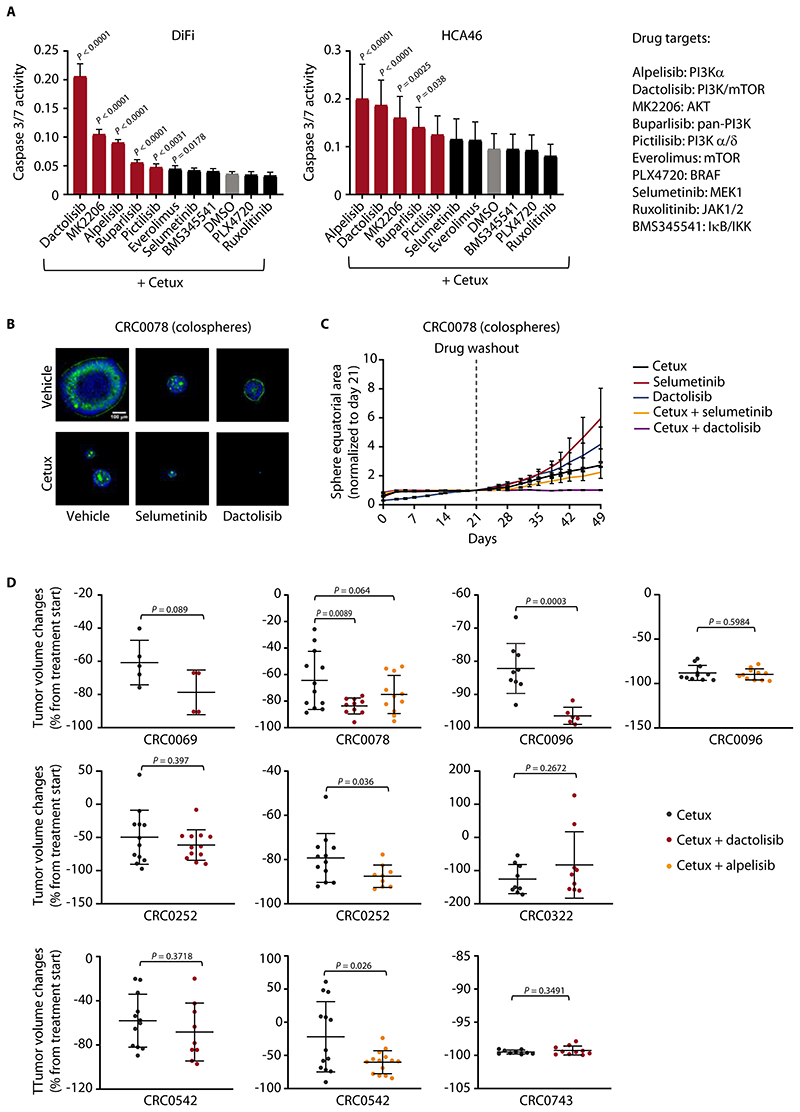
Figure 5. Combined EGFR/PI3K inhibition unleashes apoptosis and reduces residual disease in vitro but has suboptimal activity in vivo.
(A) Luciferase-based evaluation of apoptosis (assessed by caspase 3/7 activity) in DiFi and HCA46 cell lines treated for 24h with the indicated drugs at the following concentrations: cetuximab, 20 μg/ml; BMS345541, ruxolitinib, selumetinib, PLX4720, alpelisib, 1 μM; dactolisib, 250 nM; everolimus, 50 nM; pictilisib, 100 nM; MK2206, 0.5 μM; buparlisib, 0.5 μM. The effect of cetuximab alone is indicated by the grey bar. The effect of combined treatment with cetuximab and PI3K/AKT inhibitors is indicated by red bars. Results represent the means ± SD of 2 independent experiments performed in biological quintuplicates (n = 10). Statistical analysis (combinatorial treatment versus cetuximab alone) by one-way ANOVA followed by Benjamini, Krieger and Yekutieli FDR correction. Cetux, cetuximab. (B) Representative confocal images of PuraMatrix-embedded CRC0078 colospheres treated for 2 weeks with vehicle (DMSO), cetuximab (10 μg/ml), selumetinib (300 nM), or dactolisib (100 nM), alone or in combination, prior to fixation and staining for F-actin (green) and DNA (blue). (C) Growth curves of PuraMatrix-embedded CRC0078 colospheres treated with cetuximab (30 μg/ml), selumetinib (1 μM), or dactolisib (300 nM), alone or in combination, for 21 days and then kept without drugs for additional 28 days. Time-lapse imaging was carried out by bright field microscopy, and individual equatorial areas were measured with Image J software. Average time-dependent area variation is represented as fold change relative to area value at day 21. Results are the means ± SEM of at least 15 colospheres for each experimental condition. Statistical analysis by two-way ANOVA (calculated after drug withdrawal) followed by Benjamini, Krieger and Yekutieli FDR correction: cetuximab + selumetinib versus cetuximab alone, P = 0.0138; cetuximab + dactolisib versus cetuximab alone, P < 0.0001. (D) Tumor volume changes in PDXs from mice treated with the indicated modalities for 4 weeks. Cetuximab, 20 mg/kg (intraperitoneal injection twice a week); dactolisib, 35 mg/kg (daily oral gavage); alpelisib, 25 mg/kg (daily oral gavage). Dots represent volume changes of PDXs from individual mice, and plotsshow the means ± SD for each treatment arm. n = 4 to 14 animals per each treatment arm. For CRC0069, CRC0096, CRC0252, CRC0322, CRC0542, and CRC0743, statistical analysis was performed by two-tailed unpaired Welch’s t-test. For CRC0078, statistical analysis was performed by one-way ANOVA followed by Benjamini, Krieger and Yekutieli FDR correction. Tumor variation outliers were excluded using the ROUT method (GraphPad Prism). Pre- and end-of-treatment tumor volumes in individual mice are reported in fig. S20.

