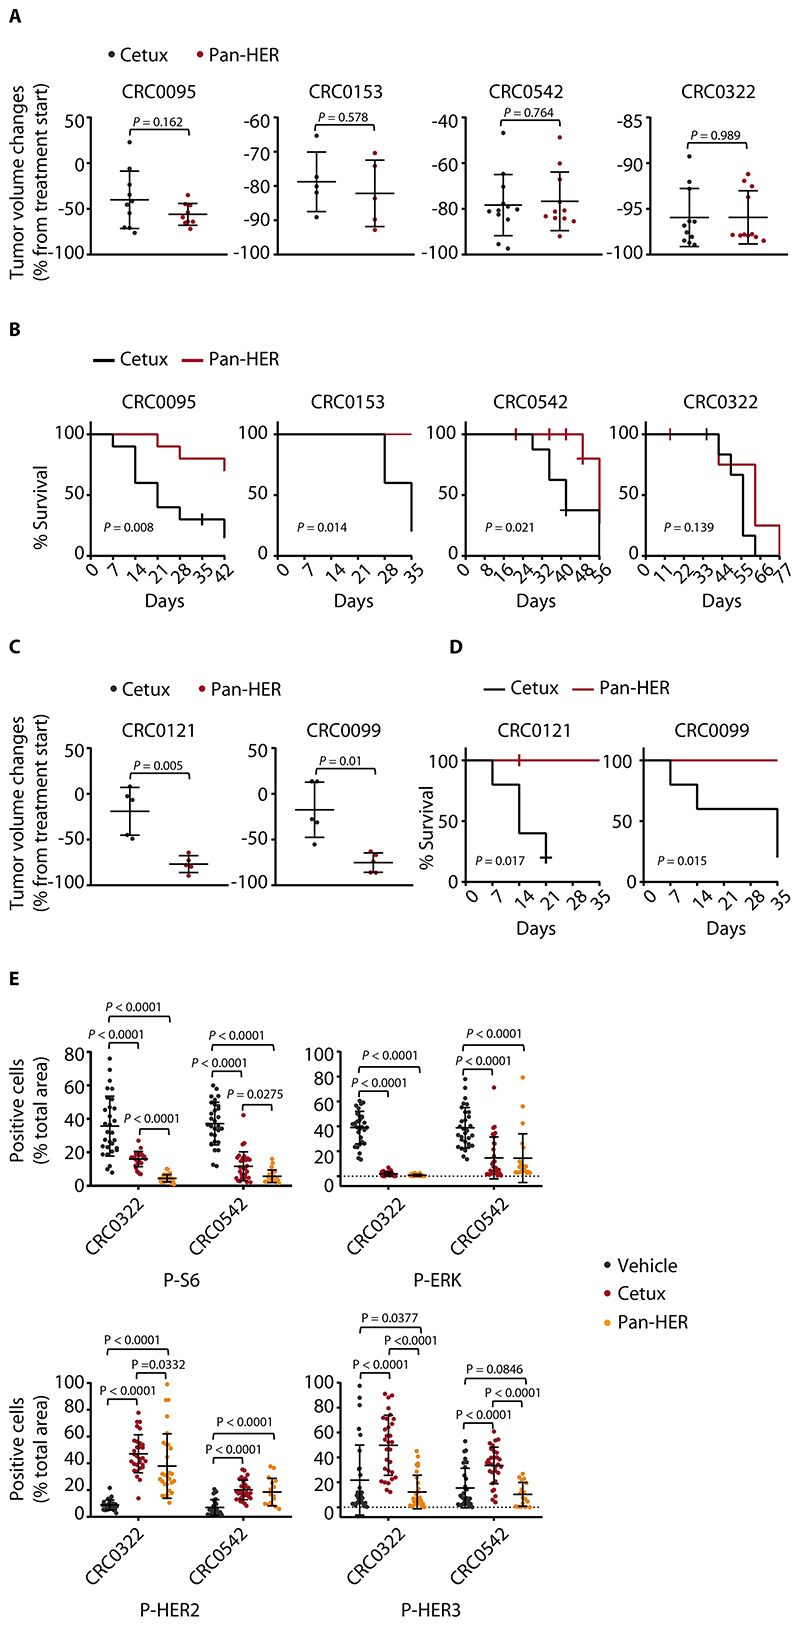
Figure 7. Targeting HER2/HER3 together with EGFR provides long-term therapeutic benefits in PDX trials.
(A) Tumor volume changes in PDXs treated with the indicated modalities for 4 weeks. Cetuximab, 20 mg/kg (intraperitoneal injection twice a week); Pan-HER, 60 mg/kg (intraperitoneal injection twice a week). Dots represent volume changes of individual mice, and plots show the means ± SD for each treatment arm. n = 5 to 12 animals per each treatment arm. Statistical analysis by two-tailed unpaired Welch’s t-test. Tumor variation outliers were excluded using the ROUT method (GraphPad Prism). Cetux, cetuximab. (B) Kaplan-Meier survival curves in PDXs after discontinuation of the indicated treatments. n = 5 to 10 animals per each treatment arm. Statistical analysis by Log-rank (Mantel-Cox) test. (C) Tumor volume changes in PDXs treated with the indicated modalities for 4 weeks. n = 5 animals per each treatment arm. Statistical analysis as in A. (D) Kaplan-Meier survival curves in PDXs after discontinuation of the indicated treatments. n = 5 animals per each treatment arm. Statistical analysis as in B. (E) Morphometric quantification of the indicated phosphoproteins in PDXs CRC0322 and CRC0542 after treatment with vehicle (until tumors reached an average volume of 1500 mm3), cetuximab (5 weeks), or Pan-HER (5 weeks). At the end of treatment, 3 tumors from 3 different mice were explanted and subjected to immunohistochemical analysis. Each dot represents the value measured in one optical field (40x), with 2 to 10 optical fields per tumor depending on the extent of section area (n = 16 to 30). The plots show means ± SD. Statistical analysis by one-way ANOVA followed by Benjamini, Krieger and Yekutieli FDR correction. P-S6, phospho-S6; P-ERK, phospho-ERK; P-HER2, phospho-HER2; P-HER3, phospho-HER3. Representative images for phospho-S6 and phospho-ERK immunoreactivity in CRC0542 are shown in fig. S26.

