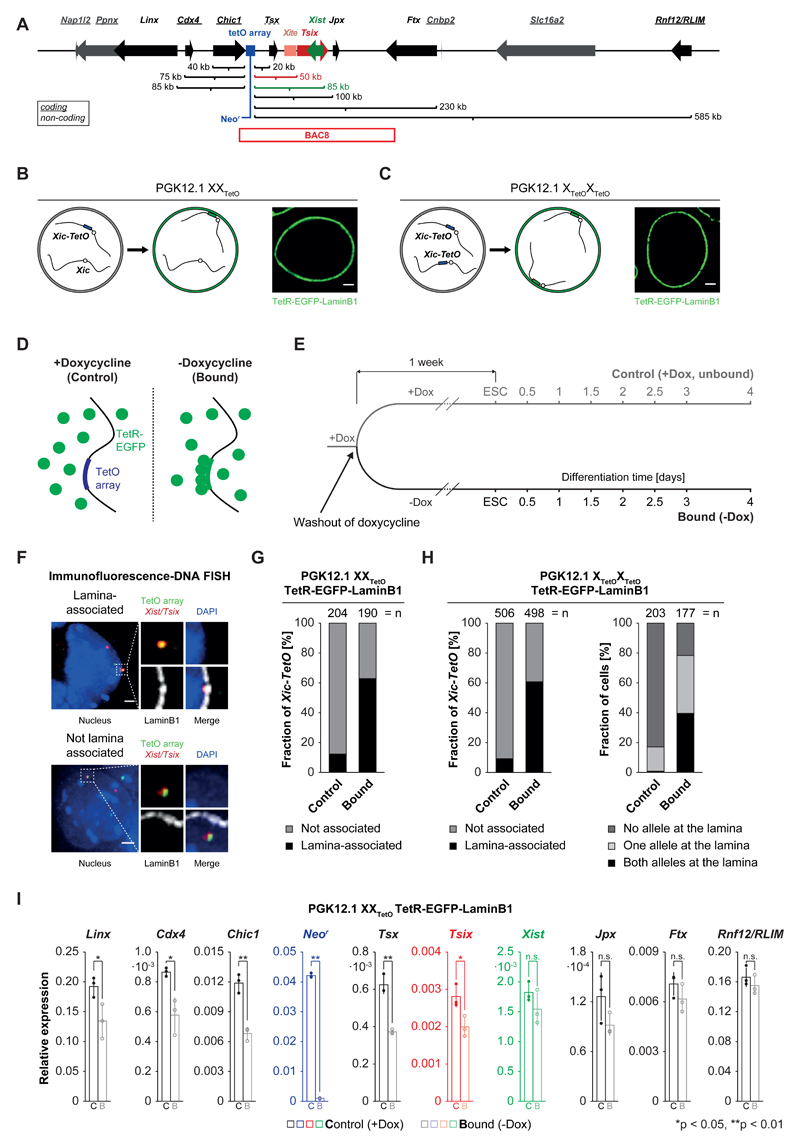
Figure 1. Expression of TetR-EGFP-LaminB1 in PGK12.1 XXTetO/XTetOXTetO cells induces relocalization of the Xic-TetO and gene repression in the relocalized Xic.
A) Schematic representation of the murine X-inactivation center (Xic) with an insertion of a TetO array (blue box, 224 repeats, 11.2 kb). Indicated are the linear genomic distances of the transcriptional start sites of genes in the Xic with respect to the insertion site of the TetO array. Genes giving rise to non-coding transcripts are underlined. The position of BAC8 is indicated below the scheme. B) Schematic representation of the experimental approach for the relocalization of the single Xic-TetO to the nuclear lamina upon expression of a TetR-EGFP-LaminB1 fusion protein in heterozygous PGK12.1 XXTetO cells. The EGFP fluorescence and localization of the fusion protein are detectable in PGK12.1 XXTetO stably expressing the transgene. C) Like B) for PGK12.1 XTetOXTetO cells. D) Schematic representation of binding of TetR fusion proteins to the TetO array in the absence (bound) or presence (control) of doxycycline. E) Scheme of the experimental set up. One population of ‘control’ cells (+Dox) was separated into one population of ‘control’ cells and one population of ‘bound’ cells one week prior to initiation of differentiation. F) Immunofluorescence (IF) DNA fluorescence in situ hybridization (FISH) for the nuclear lamina (anti-LaminB1 IF) and for the TetO array locus and the Tsix/Xist region in the Xic (DNA FISH). Depicted are two representative cells with association (upper panel) or no association (lower panel) of the TetO array locus (Xic-TetO) with the nuclear lamina. Depicted is the entire nucleus as a projection (without the lamina signal) and the region of interest magnified on the right of the nucleus (with the lamina signal). Scored as association was only a direct overlap between the TetO array locus signal and the signal of the nuclear lamina as depicted in the example. Depicted are representative cells for each condition. G) Quantification of association of the single Xic-TetO with the nuclear lamina in PGK12.1 XXTetO ESCs based on IF DNA FISH as depicted in D). (n = number of scored Xic-TetO) H) Quantification of the association of the two Xic-TetO in homozygous PGK12.1 XTetOXTetO for all the Xic-TetO in a population of cells (left panel) and quantification of the association of the two Xic-TetO in single cells (right panel). (n (left) = number of scored Xic-TetO, n(right) = number of cells). I) Mean relative expression of Xic-linked genes in control (empty bars) and bound (empty bars, lighter shade) PGK12.1 XXTetO TetR-EGFP-LaminB1 cells (n = 3), assessed by qRT-PCR relative to the expression level of the Arp0 gene. Individual data points are depicted as filled and empty circles. Significant differences in gene expression are marked (asterisk: p < 0.05; double asterisk: p < 0.01; t-test (unpaired, two-tailed); error bars indicate standard deviation; p-values for genes with p<0.05: Linx 0.037, Cdx4 0.015, Chic1 0.0016, Neor 9x10⁻⁸, Tsx: 0.0011, Tsix: 0.028).

