Figure 6.
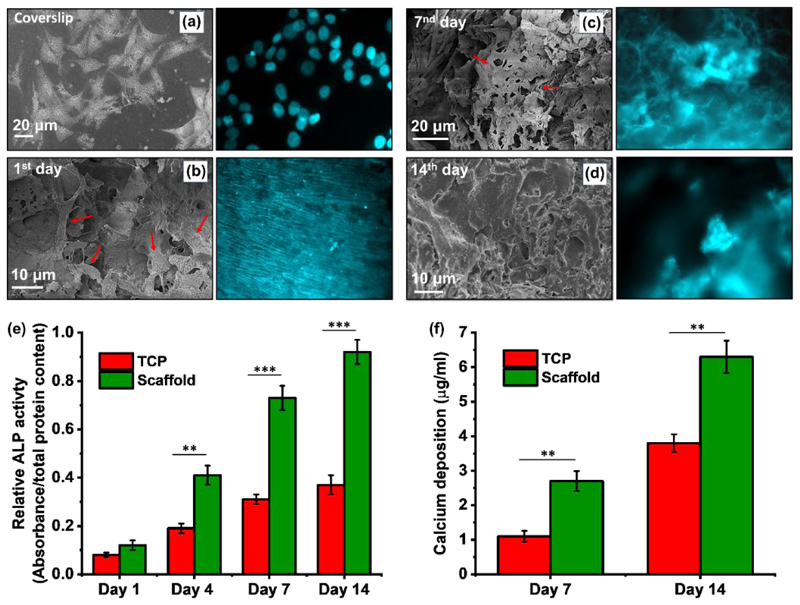
(a-d) SEM and fluorescence microscopy images (Hoechst 33342 staining) of cell growth and attachment on scaffold over 14 days. (e) ALP activity and (f) calcium content of MG-63 cultured on the scaffold for 14 days. Statistical comparisons were performed with respect to TCP, which represent the cells grown in the 2D culture flask.

