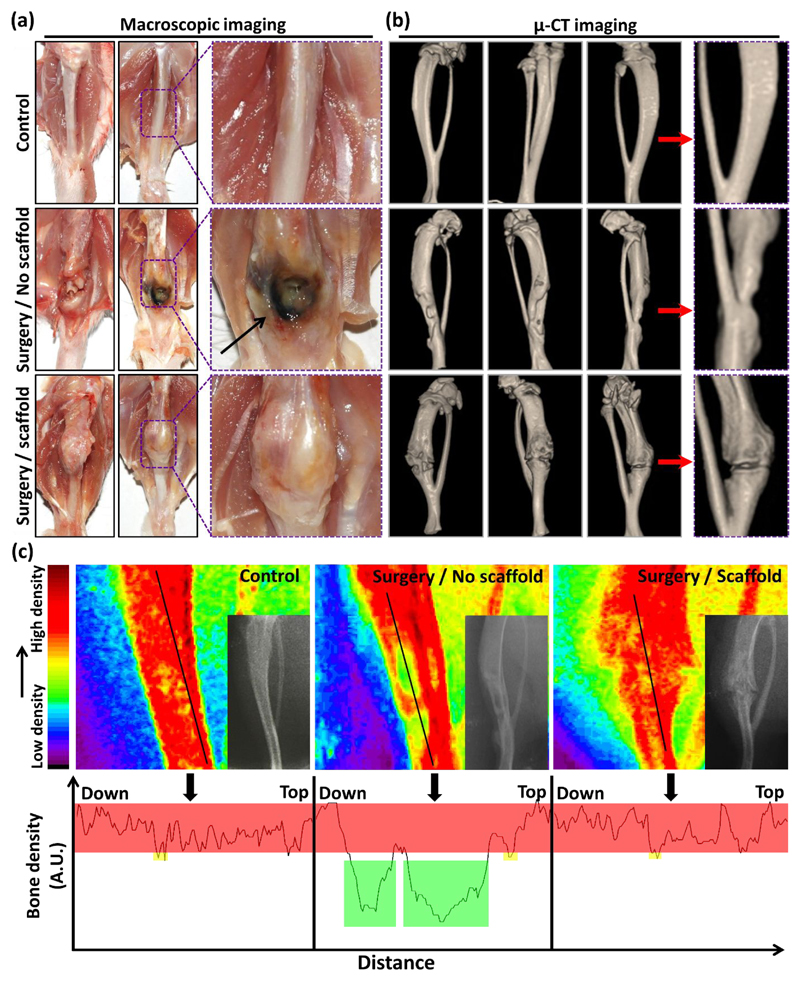
Figure 7.
(a) Macroscopic view of the scaffold implanted site after 25 days of placement in the region of the rat femur. (b) Micro-CT images of the bone in the control group without creating any defect as well as defect sites without and with scaffold after 25 days of surgery and implantation. The yellow coloured area shows the areas without bone formation in the animals with bone defect but no scaffold implantation. (c) Counterplot colour-based analysis of the bone density based on the radiographic images of the different tested groups shown in the bottom-right area of each counterplot image. The red area represents high density of the bone while green colour demonstrates the parts without any bone formation. The bone density profile of the bone areas covered by the black line drawn in counterplot colour-based bone density analysis.

