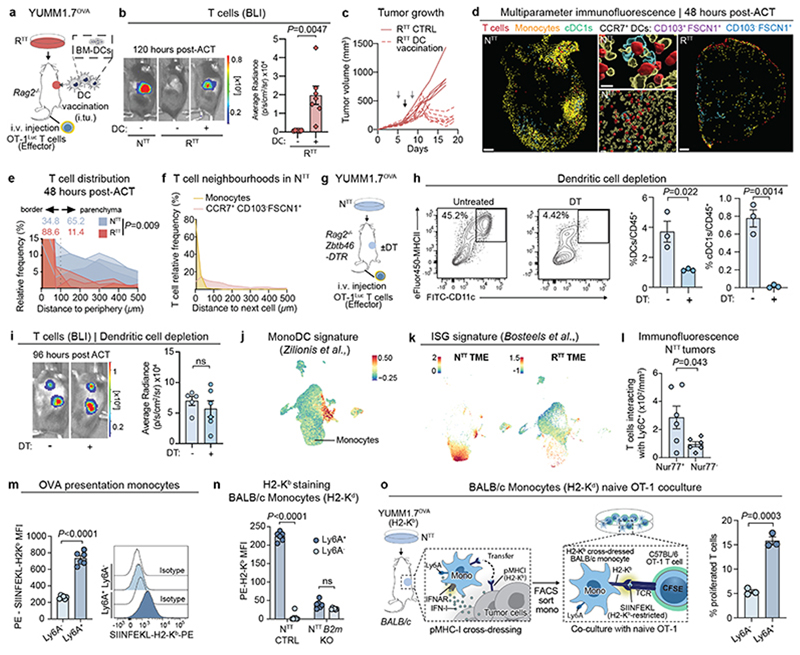
Extended Data Fig. 3. Inflammatory monocytes cross-dress with cancer-derived pMHCI complexes.
a, Scheme outlining the dendritic cell (DC) vaccination of YUMM1.7OVA RTT tumors with bone marrow-derived cDC1s (BM-DCs) injected i.tu. and treated with ACT. b, Left, representative BLI images and right, quantification of T cell infiltration by BLI (n=6 mice CTRL and n=7 mice for DC vaccination). c, Response to ACT of RTT tumors vaccinated with BM-DCs followed by ACT. Black arrow indicates the day of ACT and gray arrows the days of cDC1 vaccination (n=6 mice CTRL and n=7 mice for DC vaccination). d, Representative IF staining of YUMM1.7OVA NTT and RTT tumors in Batf3-/- Rag2-/- mice, 48 hours post ACT, scale bar in NTT=500 μm, zoom-ins=20 μm and 10μm, scale bar in RTT=1000 μm, (n=3 tumors/group). e, Quantification of relative T cell frequency and distance to the tumor periphery in NTT and RTT tumors injected in Rag2-/- Batf3-/- mice. Percentages of T cells found in the tumor border or tumor center are depicted (n=3 tumors/group). f, Quantification of relative T cell frequency and distance to the next immune cell in NTT tumors in Rag2-/- Batf3-/- mice (n=3 tumors). g, Scheme outlining the depletion of dendritic cells with diphtheria toxin (DT) in NTT tumors in Rag2-/- mice reconstituted with bone marrow from Rag2-/- zDC-DTR mice. DT was administered every 3 days starting on the day of tumor injection for the duration of the experiment. h, Contour plots depicting the frequency of dendritic cells (left) and flow quantification (flow cytometry) (n=3 tumors/group). i, Representative BLI images (right) and quantification of T cell infiltration (n=5 mice for untreated, n=6 DT treated) (left). j, Scoring of a monocyte derived dendritic cell (MonoDC) signature21 in the YUMM1.7OVA scRNA-seq. k, Scoring of the Bosteels et al.40 ISG signature (Supplementary Table 2) in the YUMM1.7OVA scRNA-seq. l, Quantification of Nur77+ or Nur77- OT-1 T cells interacting with Ly6c+ monocytes based on IF staining of NTT tumors 48 hours post-ACT (n=6 tumors). m, Median fluorescence intensity (MFI) quantification of SIINFEKL-H2Kb staining (n=6 mice/group) (left) and histograms (right). n, MFI quantification of NTT-derived H2-Kb on BALB/c pMHC-I cross-dressed monocytes (n=6 mice/group) in NTT and NTT B2m KO. o, Scheme of the process of cross-dressing and in vitro T cell activation (left) and quantification of OT-1 T cell proliferation after 72 hours of co-culture with monocytes FACS-sorted from YUMM1.7OVA NTT tumors in BALB/c mice (n=3 technical replicates). Bar graphs depict the mean ± s.e.m. Statistical analysis was performed with a two-tailed unpaired student’s t-test in b, e, h, i, l, m, n and o. ns=not significant.

