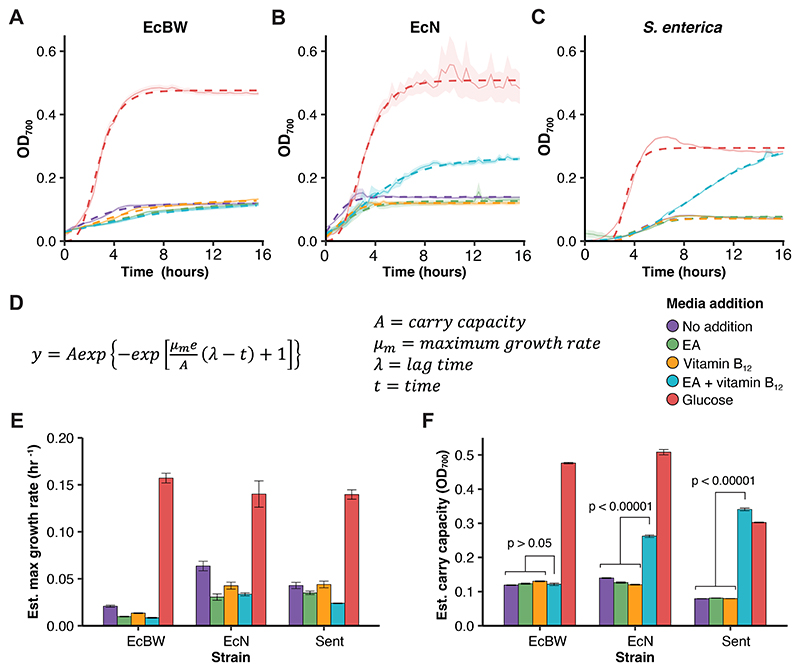
Figure 2. EA-dependent growth in E. coli Nissle 1917.
Growth curves of EcBW (A), EcN (B), and S. enterica (C) when grown in M9 supplemented with either glucose, EA, and/or vitamin B12, in triplicate. The mean and standard error are shown with a solid line and a pale ribbon, respectively, and the data was fitted with the Gompertz function (D) shown by the respective dashed lines. The estimated growth rates (E) and carry capacities (F) are shown with standard error bars. Where appropriate, p-values are given, with exact values displayed in Table S1.

