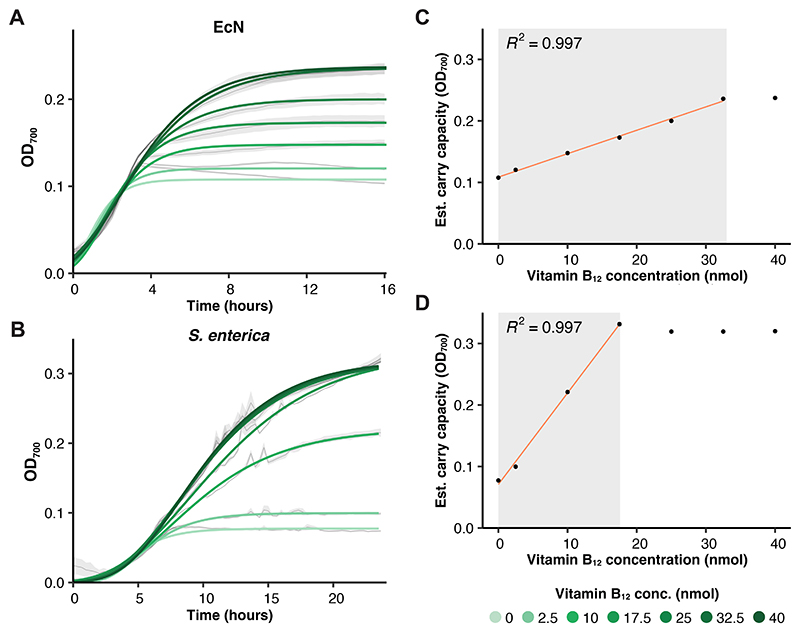
Figure 5. Control of EA-dependent growth in E. coli Nissle 1917 and S. enterica.
(A & B) Growth curves of EcN and S. enterica when grown in M9 supplemented with EA and different concentrations of vitamin B12. The mean and standard error are shown in black and grey, respectively. Gompertz model gits are given by the solid lines. (C & D) The estimated carry capacity from the growth curves, with the calculated R2 shown above.

