
Figure 3.
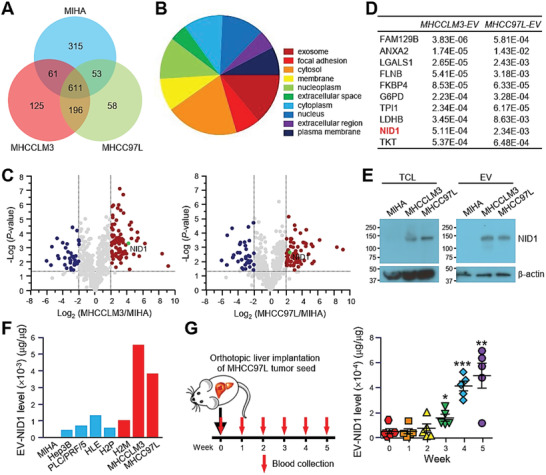
NID1 level in EVs correlates with the metastatic potential of cells and tumor burden in mice. A) Protein was extracted from EVs derived from MIHA, MHCCLM3, and MHCC97L cells and was subjected to mass spectrometry analysis (technical triplicate/sample). Venn diagram illustrating the number of proteins that were commonly and uniquely expressed in EVs of the indicated cell lines. B) Analysis of the distribution of cellular components of proteins commonly identified in MHCCLM3‐ and MHCC97L‐EVs using FunRich3.1.3. C) Volcano plots of proteins that were significantly modulated by at least fourfold in MHCCLM3‐EVs (left) and MHCC97L‐EVs (right) when compared to proteins of MIHA‐EVs with p‐value < 0.05. D) Top ten upregulated proteins identified in MHCCLM3‐EVs ranked by p‐value. Significance of their upregulation in MHCC97L‐EVs is listed accordingly. E) Immunoblots showing NID1 expression in the total cell lysate (TCL) and EVs of MIHA, MHCCLM3, and MHCC97L cells. F) Analysis of NID1 expression in EVs derived from MIHA cells and different HCC cell lines was performed in duplicate by ELISA. G) Collection of blood from mice before and after orthotopic liver implantation of luciferase‐labeled MHCC97L tumor seed (n = 5). EVs were isolated from the serum and subjected to protein extraction. Serum EV‐NID1 level was analyzed in duplicate using ELISA. Data are represented as the mean ± SEM; :p < 0.05; ::p < 0.01; :::p < 0.001 from Student's t‐test.