
Figure 4.
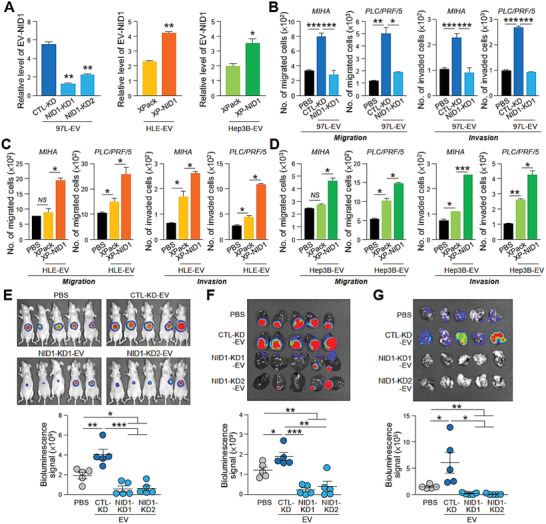
EV‐NID1 is a functional component that drives HCC motility, tumorigenesis, and metastasis. A) ELISA analysis of NID1 levels in EVs derived from MHCC97L (97L) control (CTL‐KD) and NID1 knockdown cells (NID1‐KD1 and NID1‐KD2) and control (XPack) and NID1 overexpressing cells (XP‐NID1) established in HLE and Hep3B cells. The analysis was performed in triplicate. B) Examination of the migratory potential and invasiveness of MIHA and PLC/PRF/5 cells pretreated with MHCC97L CTL‐KD‐ and NID1‐KD‐EVs. C) Examination of the migratory potential and invasiveness of MIHA and PLC/PRF/5 cells pretreated with HLE XPack‐ and XP‐NID1‐EVs. D) Examination of the migratory potential and invasiveness of MIHA and PLC/PRF/5 cells pretreated with Hep3B XPack‐ and XP‐NID1‐EVs. E) EV mouse model comparing the effects of EVs from MHCC97L CTL‐KD and NID1‐KD cells on HCC tumorigenesis and metastasis (n = 5). Image showing the luciferase signal of the animals at the end of the experiment. Quantification of the luciferase signal is shown. F) Bioluminescence imaging of dissected liver tissues. Quantification of the luciferase signal is shown. G) Bioluminescence imaging of dissected lung tissues. Quantification of the luciferase signal is shown. Three independent experiments were performed in triplicate for assays shown in (C) and (D). Data are represented as the mean ± SEM; :p < 0.05; ::p < 0.01; :::p < 0.001; NS, not significant from Student's t‐test.