
Figure 6.
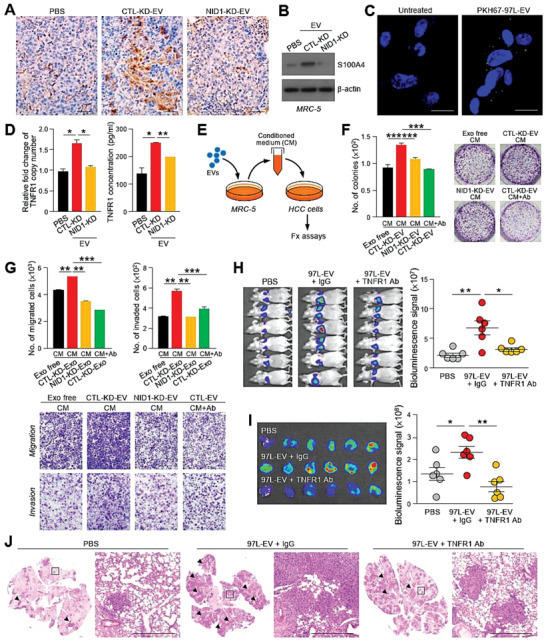
TNFR1 secreted by EV‐NID1‐activated pulmonary fibroblasts promotes HCC cell motility and colonization in the lungs. A) Immunohistochemistry of metastatic lesions in lungs tissues obtained from mice injected with PBS, MHCC97L CTL‐KD‐EVs of NID1‐KD‐EVs using anti‐α‐SMA antibody. Magnification, 20 ×; Scale bar, 25 µm. B) Immunoblotting of S100A4 expression in MRC‐5 cells treated with EVs for 24 h. C) Immunofluorescence in MRC‐5 cells after a 24 h incubation with PKH67‐labeled MHCC97L‐EVs. Scale bar: 20 µm. D) Analysis of TNFR1 copy number and concentration of soluble TNFR1 in MRC‐5 cells pretreated with the indicated EVs using qPCR and ELISA, respectively. E) Diagram illustrating the collection of conditioned medium from MRC‐5 cells pretreated with EVs for functional assays. F) Colony formation assay performed with Hep3B incubated with the conditioned medium from MRC‐5 cells incubation with EVs from CTL‐KD or NID1‐KD cells for 72 h. Anti‐TNFR1 neutralizing antibody was added to neutralize the activity of soluble TNFR1 (Ab) (0.4 µg mL−1) in the conditioned medium. Representative image shows the fixed and crystal violet‐stained colonies. G) Migration and invasion assays performed using PLC/PRF/5 cells pretreated as described in (F). Representative image shows the fixed and crystal violet‐stained migratory and invasive cells. H) Bioluminescence imaging of mice (n = 6) subjected to intravenous coinjection of murine p53−/−; Myc hepatoblasts (1 × 10⁵) with PBS, IgG (10 µg), or anti‐TNFR1 antibody (TNFR1 Ab) (10 µg). Quantification of the luciferase signal is shown. I) Ex vivo bioluminescence imaging of lung tissues. Quantification of the luciferase signal is shown. J) Representative images of H&E staining of lung tissues. Examples of metastatic lesions are indicated by arrowheads. Insets show the enlarged area of the metastatic lesions. Magnification, 2.5 ×; Scale bar, 500 µm. Three independent experiments were performed in triplicate for assays shown in (D)–(G). Data are represented as the mean ± SEM; :p < 0.05; ::p < 0.01; :::p < 0.001; NS, not significant from Student's t‐test.