
Figure 7.
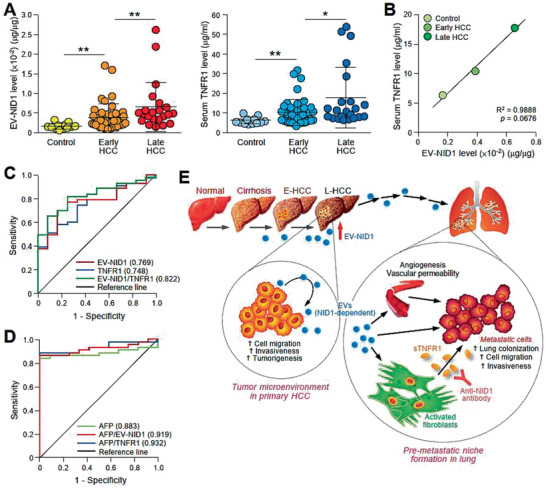
EV‐NID1 and serum TNFR1 levels correlate with the tumor stage of HCC. A) ELISA analysis of NID1 expression in circulating EVs obtained from sera collected from individuals without liver disease (Control) (n = 12), patients with early (n = 43) and late stage (n = 22) HCC (left). ELISA analysis of serum TNFR1 in the same subjects (right). ELISA was performed in duplicate. B) Correlation between EV‐NID1 and serum TNFR1 levels determined in (A) using Pearson correlation test. C) ROC curves of EV‐NID1, serum TNFR1, and combined EV‐NID1 and serum TNFR1 for discriminating control subjects and patients with early stage HCC. D) ROC curves of AFP, AFP in combination with EV‐NID1, or serum TNFR1 for discriminating control subjects and patients with early stage HCC. E) Proposed signaling mediated by EV‐NID1. The EV‐NID1 level increases with HCC development. EV‐NID1 derived from metastatic HCC cells promotes liver tumor development and distant metastasis to the lungs. EV‐NID1 increases pulmonary vessel leakiness, angiogenesis, and colonization of cancer cells to the lungs and activates pulmonary fibroblasts to secrete TNFR1, which in turn promotes HCC cell growth and motility. ROC, receiver operating characteristic. Data are represented as the mean ± SEM; :p < 0.05 and ::p < 0.01 from Student's t‐test.