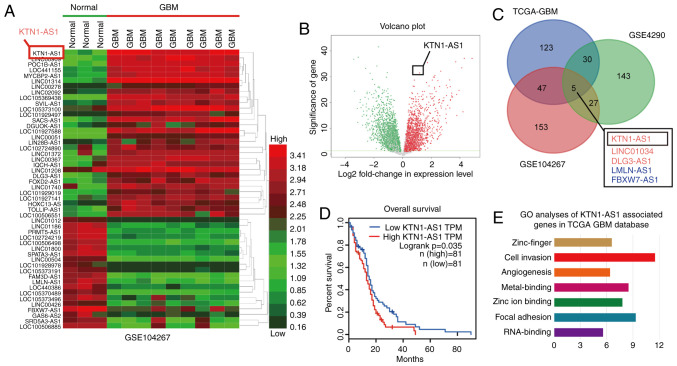
Figure 1.
KTN1-AS1 was overexpressed in GBM tissues. (A) Hierarchical clustering analysis showing lncRNAs that are differentially expressed in the GEO dataset (GSE104267; glioma tissues, n=3; normal tissues, n=9; FC>2.0; P<0.01). (B) Volcano plot suggested that KTN1-AS1 was upregulated in the two groups of lncRNA from GEO database. (C) Five significantly differentially expressed lncRNAs were determined in TCGA, GSE104267 and GSE4290 datasets. (D) Kaplan-Meier survival curve of GBM patients (TCGA) based on the levels of KTN1-AS1 (log-rank test; P=0.0053). (E) Top-ranked genes in GO term analysis using DAVID, indicating that genes associated with cell invasion were enriched among those affected by KTN1-AS1. lncRNA, long non-coding RNA; KTN1-AS1, Kinectin 1 Antisense RNA 1; GBM, glioblastoma; GO, Gene Ontology; TCGA, The Cancer Genome Atlas; GEO, the Gene Expression Omnibus; TPM, Trans per kilobase of exon model per million. FC, fold change; FDR, false discovery rate.

