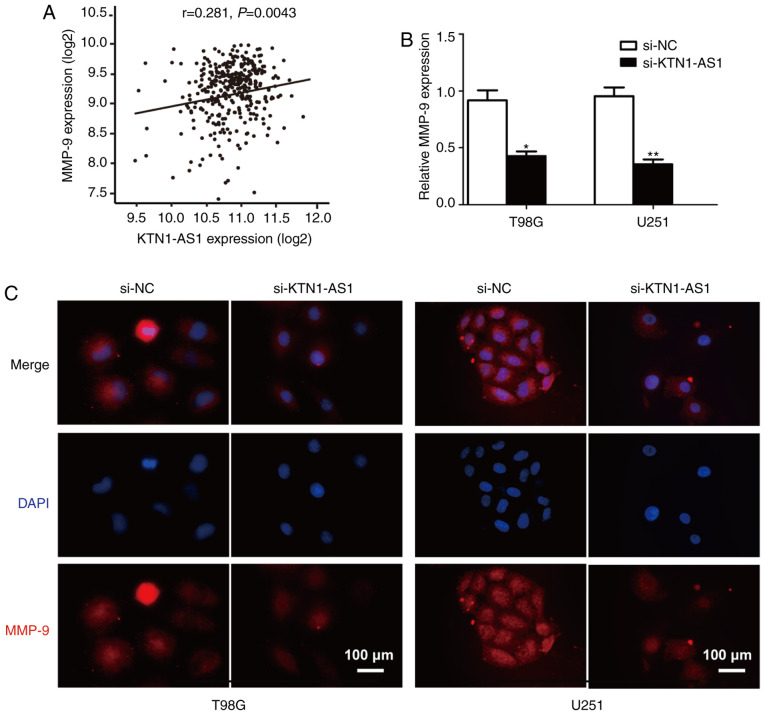
Figure 3.
Expression of MMP-9 was evaluated in glioma cells. (A) Correlation between KTN1-AS1 and miR-505-3p expression in TCGA database (r=0.281; P=0.0043). (B) Reverse transcription-quantitative PCR analysis of MMP-9. (C) Immunofluorescent staining revealed downregulated expression of MMP-9 in si-KTN1-AS1 cells. Magnification, ×400; scale bar, 100 µm. Data were presented as the means ± standard error of the mean of at least three independent experiments. *P<0.05 and **P<0.01. GBM, glioblastoma; KTN1-AS1, Kinectin 1 Antisense RNA 1; MMP, matrix metalloproteinase; siRNA, small interfering RNA; NC, negative control.

