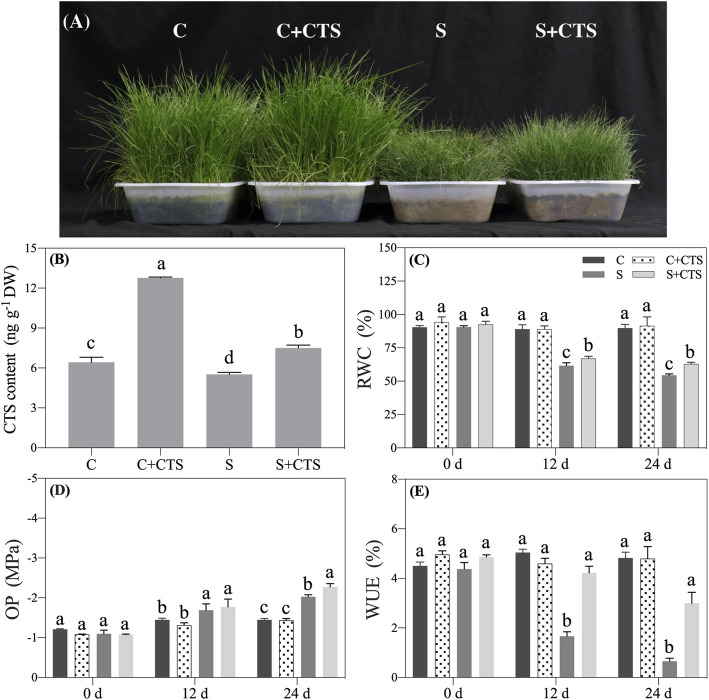
Fig. 1.
Changes in (a) phenotypes at 24 d, (b) CTS content at 24 d, (c) relative water content (RWC), (d) osmotic potential (OP), and (e) water use efficiency (WUE) in leaves of creeping bentgrass affected by the application of chitosan (CTS) under normal and salt stress conditions. Bars represent standard errors. Same letters above columns indicate no significant difference at a given day of treatment (n = 4, and p ≤ 0.05). C, control; C + CTS, control pretreated with CTS; S, salt stress; S + CTS, salt-stressed plants pretreated with CTS

