Fig. 4.
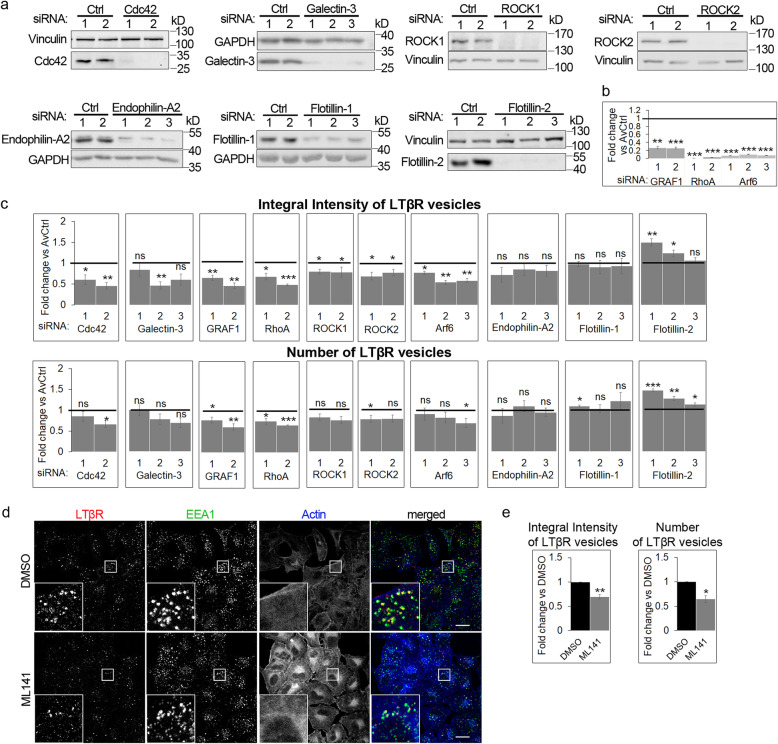
Ligand-bound LTβR is internalized through CIE routes. a A549 cells were transfected with siRNAs (two or three oligonucleotides per gene, denoted with consecutive numbers) against Cdc42, galectin-3, ROCK1, ROCK2, endophilin-A2, flotillin-1, flotillin-2, along with non-targeting control (Ctrl) siRNAs (two oligonucleotides denoted with consecutive numbers) and analyzed by Western blot for knock-down efficiency. Vinculin and GAPDH were used as loading controls. Representative blots are shown. b A549 cells were depleted of GRAF1, RhoA or Arf6 using siRNAs (two or three oligonucleotides per gene, denoted with consecutive numbers), along with non-targeting (Ctrl) siRNAs (two oligonucleotides) and analyzed by qRT-PCR with respect to the knock-down efficiency of GRAF1, RhoA or Arf6, respectively. Values are presented as a fold change vs averaged non-targeting controls (AvCtrl), set as 1 (line). Data represent the means ± SEM, n = 3; **P ≤ 0.01; ***P ≤ 0.001 by one sample t test. c A549 cells depleted of the indicated endocytic regulators with siRNAs (at least two siRNAs per gene, denoted with consecutive numbers) and stimulated for 30 min with Ago were immunostained for the ligand-bound LTβR and imaged using confocal microscopy. Graphs represent the analysis of the resulting images with respect to integral intensity (top) and number (bottom) of vesicles marked with ligand-bound LTβR. Values are presented as fold change vs AvCtrl set as 1 (line). Data represent the means ± SEM, n ≥ 3; ns - P > 0.05; *P ≤ 0.05; **P ≤ 0.01; ***P ≤ 0.001 by one sample t test. d A549 cells were treated with DMSO or ML141, stimulated with Ago for 30 min and immunostained for the ligand-bound LTβR and EEA1. Actin was stained with phalloidin. Insets show magnified views of boxed regions in the main images. Scale bars, 20 μm. e Graphs represent quantitative analysis of microscopic images from experiments exemplified in d with respect to integral intensity and number of LTβR-positive vesicles. Values are presented as fold change vs DMSO set as 1. Data represent the means ± SEM, n = 4; *P ≤ 0.05; **P ≤ 0.01 by one sample t test

