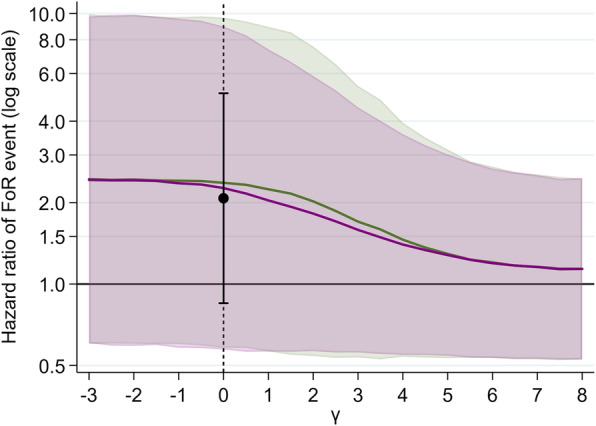
Fig. 5.

Estimate of hazard ratio (and 95% confidence region) for different values of γ after multiple imputation. γ was set to 0 (random censoring) for all Highly Unlikely events. In this analysis, γ represents the log hazard of FoR at the time of censoring as compared to another (covariate-matched) individual that is not censored. The green line (HR) and region (95% CI) corresponds to the assumption that the hazard ratio of an FoR event was double for Possible events as compared to Unlikely events; the purple line (HR) and region (95% CI) corresponds to the assumption that the hazard ratio of an FoR event was ten times for Possible events as compared to Unlikely events
