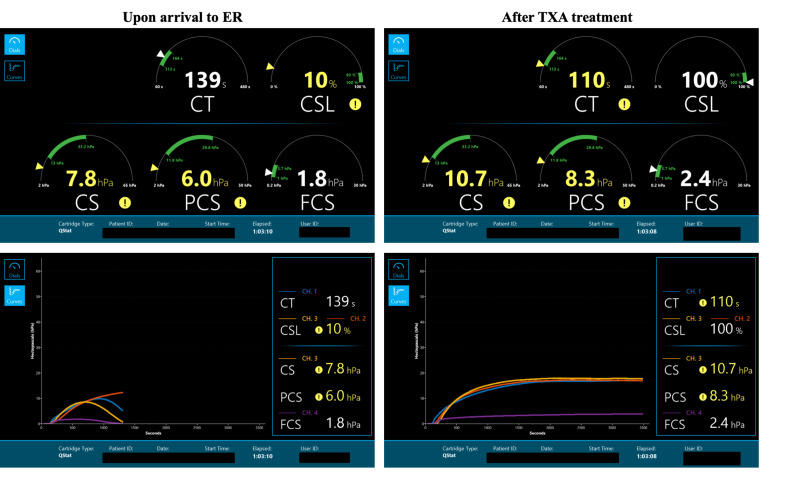
Figure 1.
Quantra QStat dials and curves generated on arrival to the emergency room (ER) (left panels) and after the administration of antifibrinolytics (right panels). For each dial, the green bar represents the normal reference range. Values outside the reference range are flagged with a different color and a warning sign. As expected, after the administration of antifibrinolytics, the QStat CSL parameter returns within the normal range from an initial value of 10% indicating significant clot dissolution (as also confirmed from the corresponding curves). CSL, Clot Stability to Lysis; TXA, tranexamic acid.

