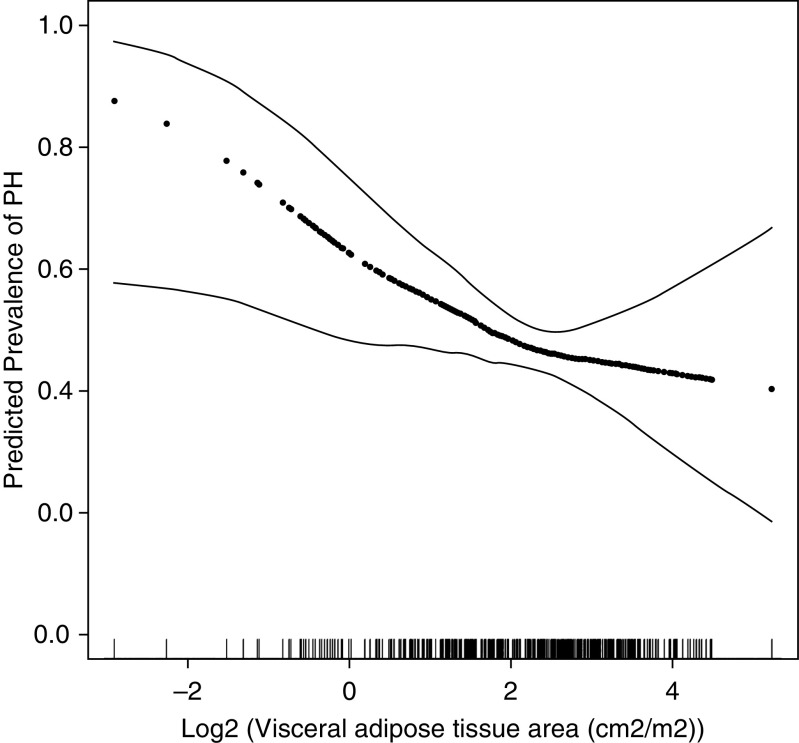
Figure 4.
Continuous associations between visceral adipose tissue area and the prevalence of pulmonary hypertension using a generalized additive model. Thick dotted lines: smoothed regression lines adjusted to age, sex, race/ethnicity, lung disease diagnosis, forced vital capacity, and pulmonary artery wedge pressure. Thin solid lines: 95% confidence intervals. PH = pulmonary hypertension.

