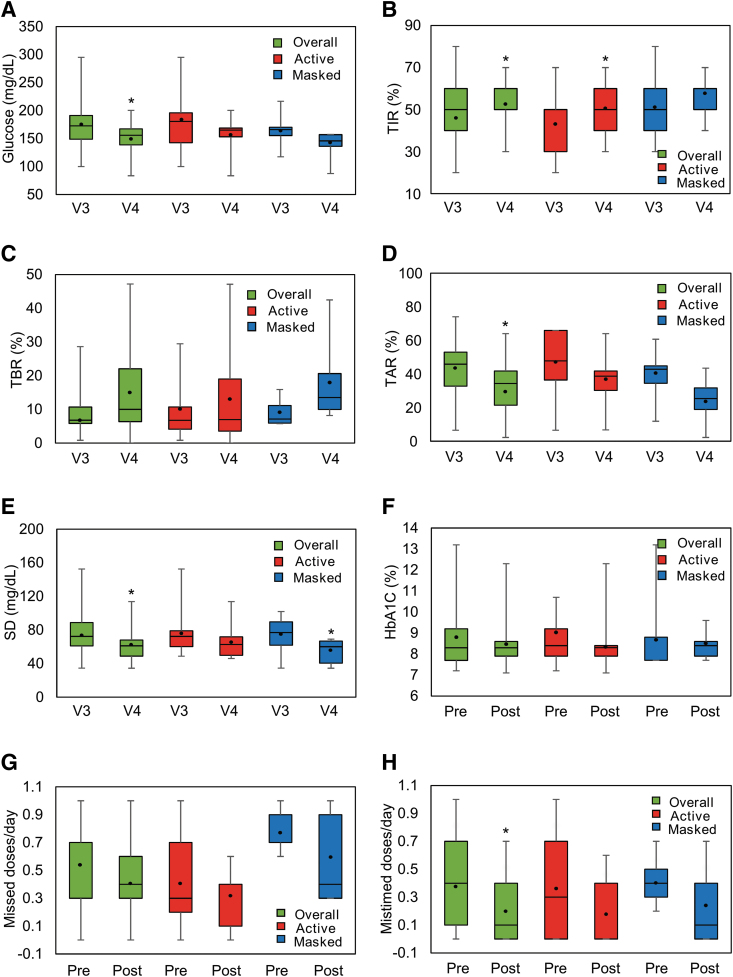
FIG. 1.
Effect of Insulclock® on glycemic control, variability, and treatment adherence. The box-plots show median, Q1, Q3, Min, and Max values for (A) glucose, (B) TIR, (C) TBR, (D) TAR, and (E) SD at Visit 3 (V3) and Visit 4 (V4), and (F) HbA1C, (G) missed and (H) mistimed insulin doses at baseline (pre) and Visit 5 (post). Black dots indicate the mean.*P < 0.05 from baseline (Student's t-test). HbA1C, glycated hemoglobin; SD, standard deviation; TAR, time above range; TBR, time below range; TIR, time in range. Color graphics are available online.

