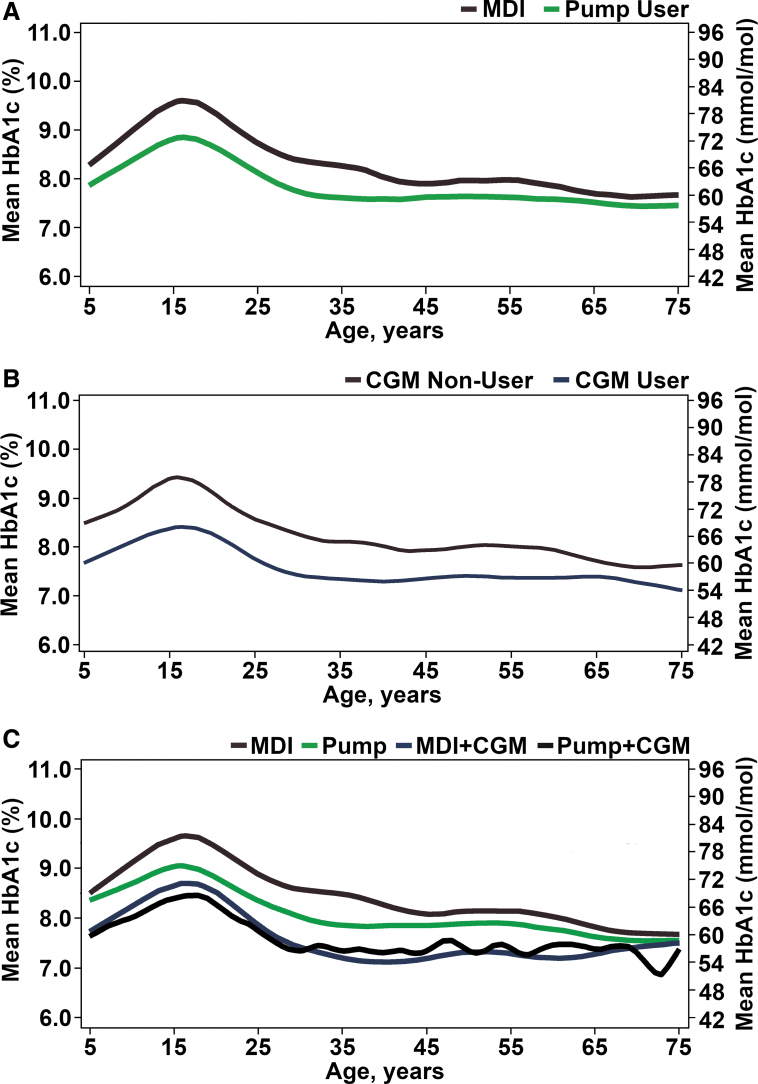
FIG. 2.
(A) Average A1c from early childhood to elderly by technology use: insulin delivery method. Solid red line represents multiple daily injection (N = 5006). Solid green line represents pump users (N = 6025). (B) Average A1c from early childhood to elderly by technology use: continuous glucose monitor (N = 15,418). Solid red line represents CGM nonuser (N = 11,199). Solid blue line represents CGM user (N = 4219). (C) Average A1c from early childhood to elderly by technology use: insulin delivery method and continuous glucose monitoring (N = 15,187). Solid red line represents multiple daily injection (N = 5006). Solid green line represents insulin pump (N = 6025). Solid blue line represents multiple daily injection and CGM use (N = 649). Solid black line represents pump and CGM use (N = 3507). CGM, continuous glucose monitor.

