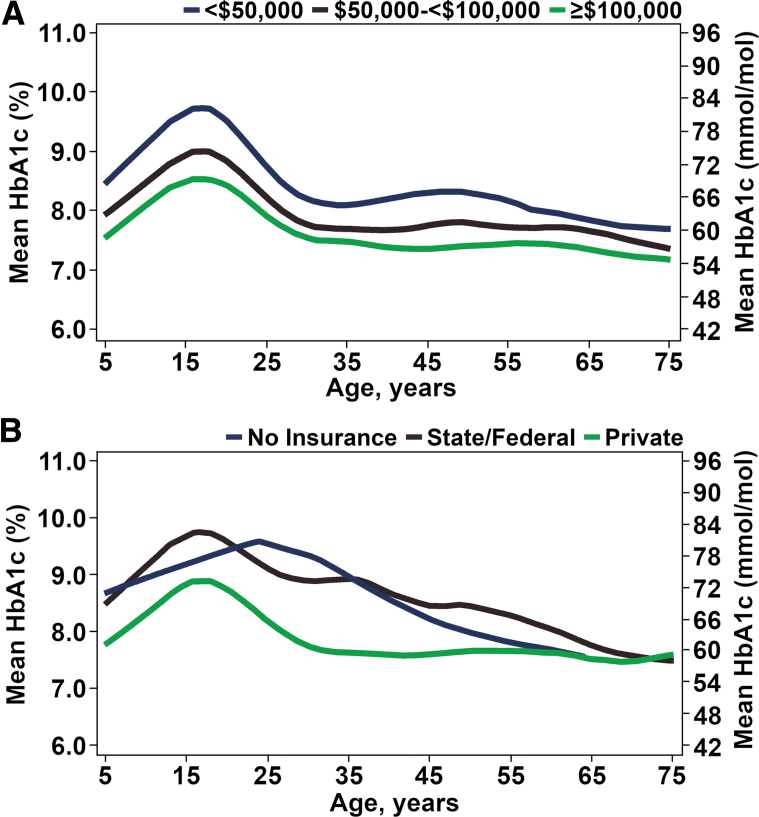
FIG. 3.
(A) Average A1c from early childhood to elderly by SES: income (N = 11,438). Solid blue line represents <$50,000 (N = 3659). Solid red line represents $50,000 to <$100,000 (N = 1850). Solid green line represents ≥$100,000 (N = 5959). (B) Average A1c from early childhood to elderly by SES: insurance status (N = 15,001). Solid blue line represents no insurance (N = 176). Solid red line represents state/federal insurance (N = 3786). Solid green line represents private insurance (N = 11,039). SES, socioeconomic status.

