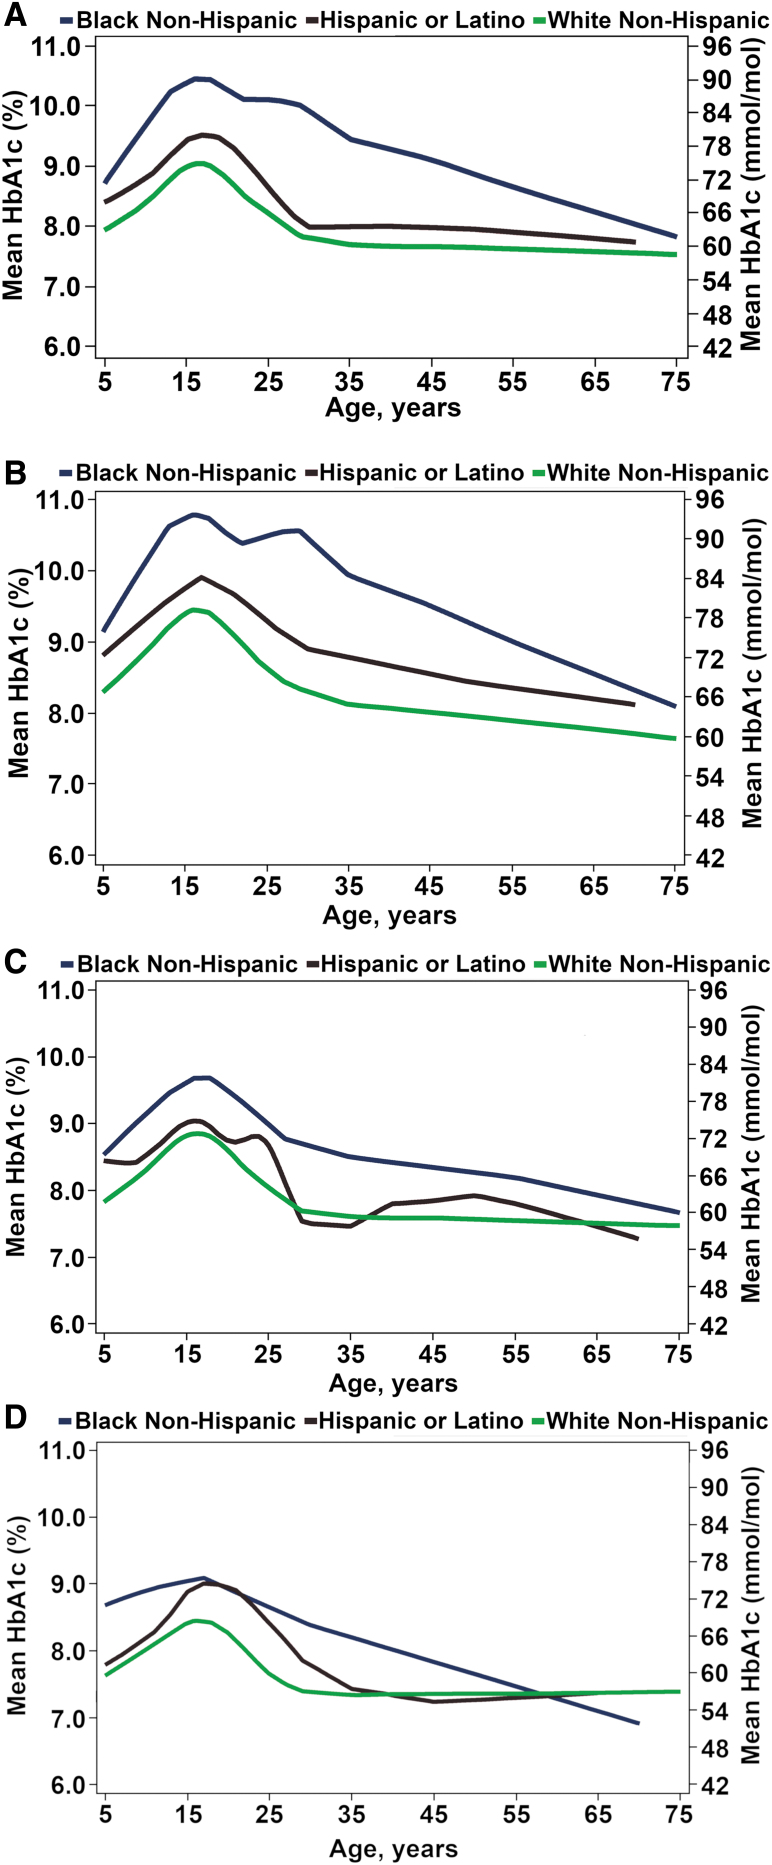
FIG. 5.
(A) Average A1c from early childhood to elderly by race/ethnicity (N = 15,780). Solid blue line represents black non-Hispanic (N = 942). Solid red line represents Hispanic or Latino (N = 1664). Solid green line represents white non-Hispanic (N = 12,339). (B) Average A1c from early childhood to elderly by race/ethnicity and technology use: no pump or CGM (N = 10,491). Solid blue line represents black non-Hispanic (N = 840). Solid red line represents Hispanic or Latino (N = 1319). Solid green line represents white non-Hispanic (N = 8332). (C) Average A1c from early childhood to elderly by race/ethnicity and technology use: pump users (N = 4668). Solid blue line represents black non-Hispanic (N = 587). Solid red line represents Hispanic or Latino (N = 742). Solid green line represents white non-Hispanic (N = 3339). (D) Average A1c from early childhood to elderly by race/ethnicity and technology use: CGM users (N = 4081). Solid blue line represents black non-Hispanic (N = 73). Solid red line represents Hispanic or Latino (N = 304). Solid green line represents white non-Hispanic (N = 3641).

