
Figure 6. The CAR-T recognized CD19 isoform is expressed in the adult human brain.
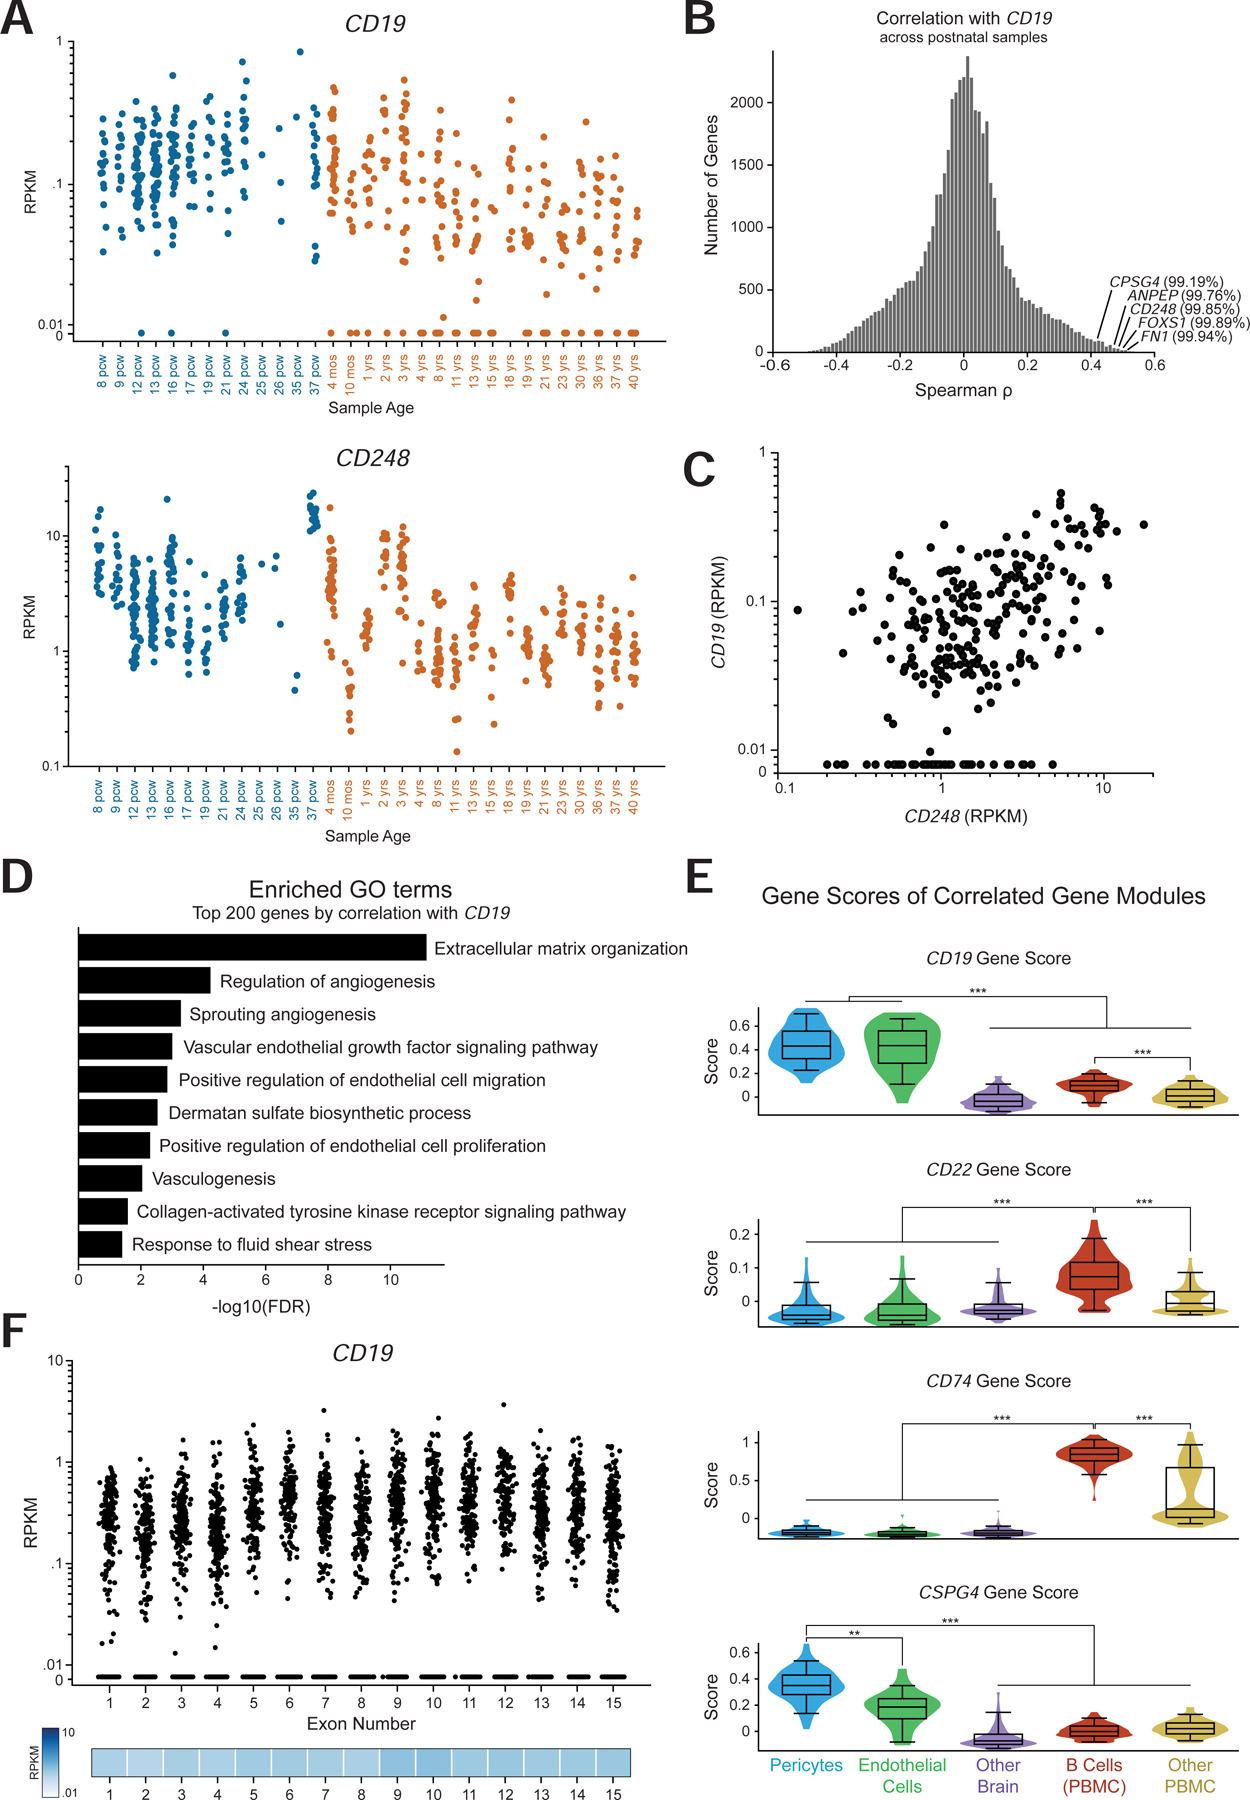
(A) Expression of CD19 (top) and CD248 (bottom) in data. Colors indicate prenatal and postnatal samples, and the different samples from distinct regions but the same age are plotted on the same x coordinate. (B) Histogram of the distribution of spearman correlation values for all genes with CD19 expression in only postnatal samples. The indicated percentiles indicate the percentile of that gene’s correlation. (C) Scatter plot of CD248 against CD19 RPKM values in only postnatal samples. (D) Enriched GO terms in the top 200 genes by spearman correlation with CD19. (E) Gene score distribution in single cells belonging to pericyte or endothelial clusters, as well as other brain cells; along with B cells and other PBMCs. Gene score was calculated with the top 30 genes by spearman correlation. (F) RPKM values per exon of CD19 in the Brainspan data, showing expression of the key exons 2 and 4 for CAR-T cell recognition.