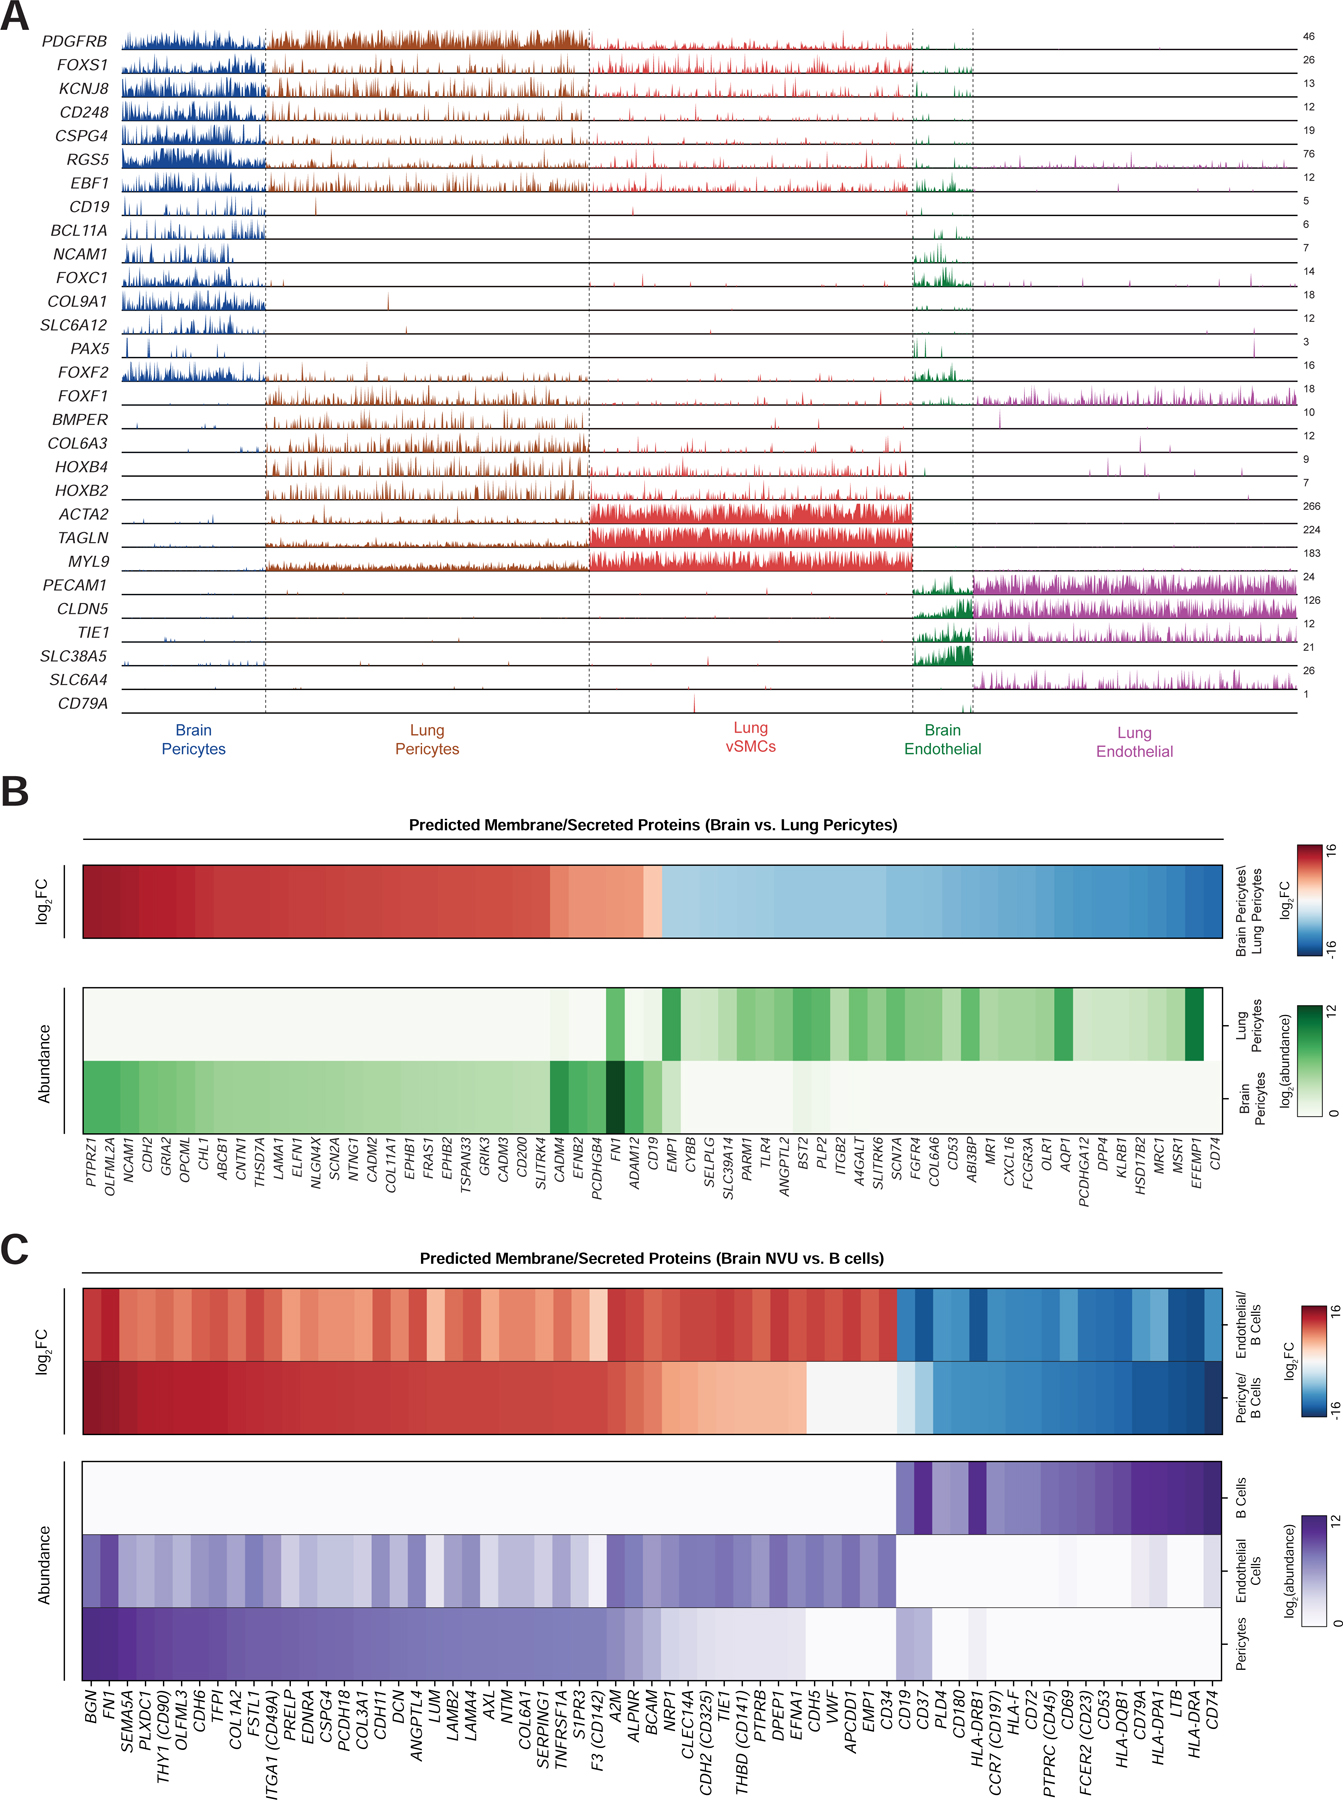
Figure 7. Brain pericyte-specific expression of CD19.

(A) Track plot showing expression of selected marker genes for each population. Note that CD19 expression is limited to brain pericytes, but not lung pericytes. Additionally, brain pericytes express certain transcription factors, such as BCL11A, that are enriched in B cells. Y-axis labels indicate maximum TPM value. (B) (top) heatmap of log2 fold-change in gene expression of surface/secreted genes between brain and lung pericytes. (bottom) heatmap of expression of the same genes. Abundance data has been quantile-normalized to improve comparison of relative expression between the two populations. (C) heatmaps showing (top) log2 fold-change and (bottom) quantile-normalized abundance, as in (b). Comparisons are made between brain pericytes, brain endothelial cells, and B cells (from PBMCs), and genes are ordered by log2 fold-change between pericytes and B cells.
