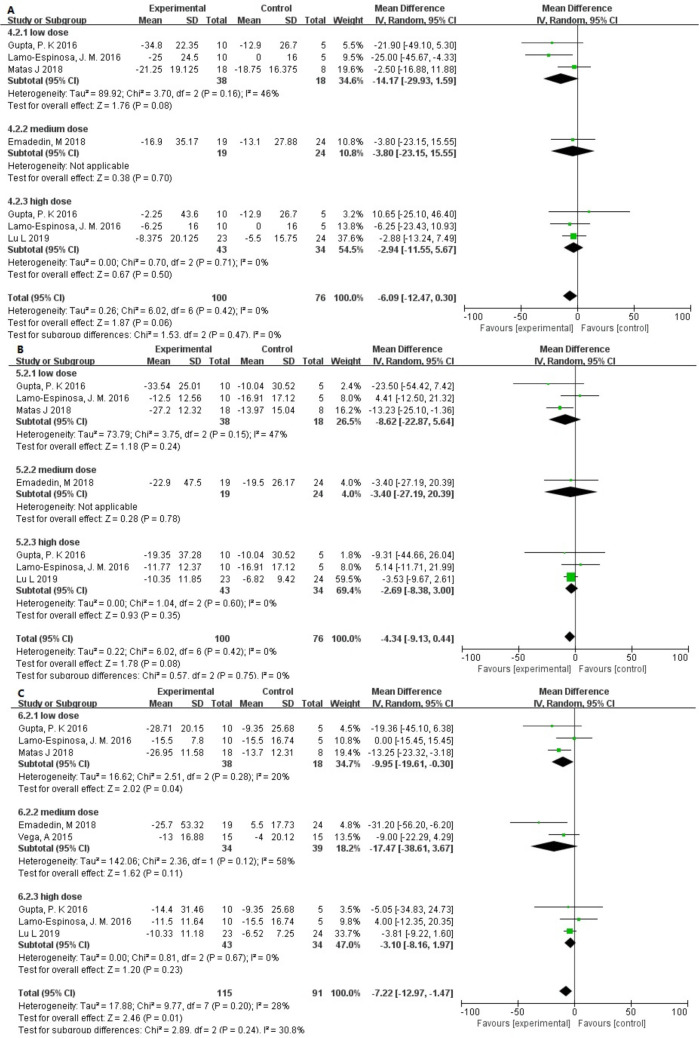
Fig. 5.
Forest plots of mean difference (MD) on function according to dose groups: a) MDs of Western Ontario and McMaster Universities Osteoarthritis Index (WOMAC)22 stiffness, b) MDs of WOMAC physical function, and c) MDs of WOMAC total. CI, confidence interval; I, inverse variance method.

