
Figure 1:
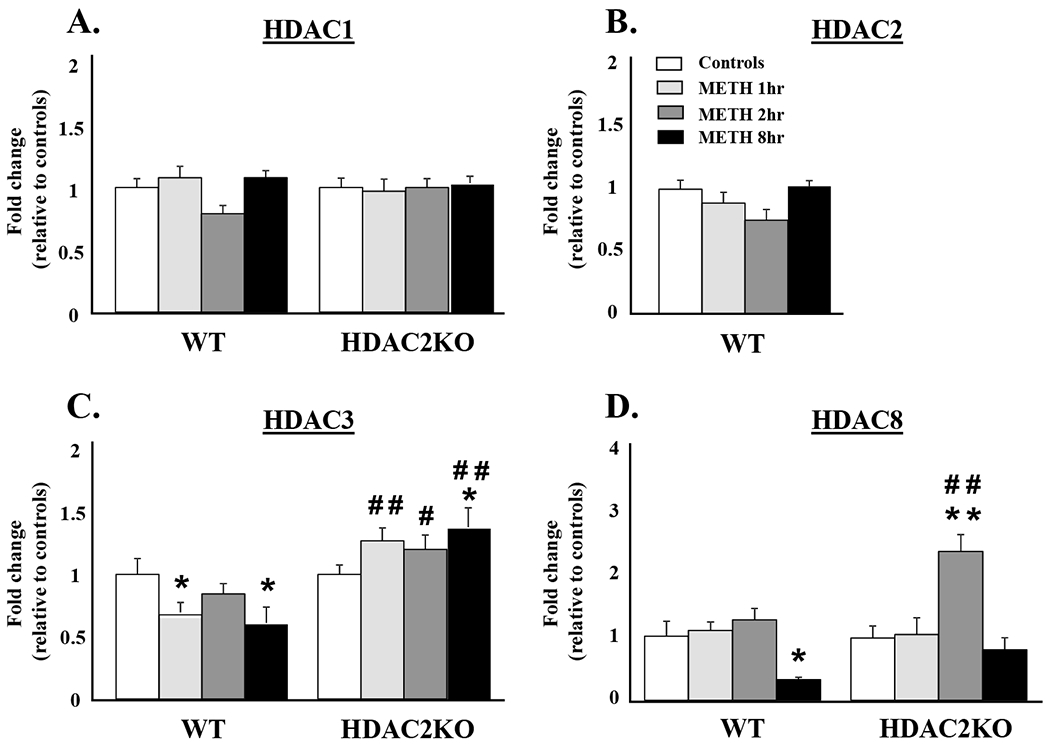
METH-induced transcriptional responses in members of the Class I HDAC family: (A) HDAC1, (B) HDAC2, (C) HDAC3, and (D) HDAC8. WT and HDAC2KO mice were injected with a single dose of METH (20 mg/kg) and euthanized 1hr, 2hrs, and 8hrs later. Total RNA was extracted from the NAc and used in qRT-PCR assays. The relative amounts of transcripts were normalized to Cltc. Statistical significance was determined by ANOVAs followed by post-hoc tests were appropriate. Data are presented as means ± SEM (n = 6 animals per genotype per time point) and were examined using two-way ANOVAs. Key to statistics: * = p < 0.05, ** = p < 0.01, in comparison to respective saline treated controls; # = p < 0.05, ## = p < 0.01, in comparison to respective METH treated WT mice.