
Figure 2.
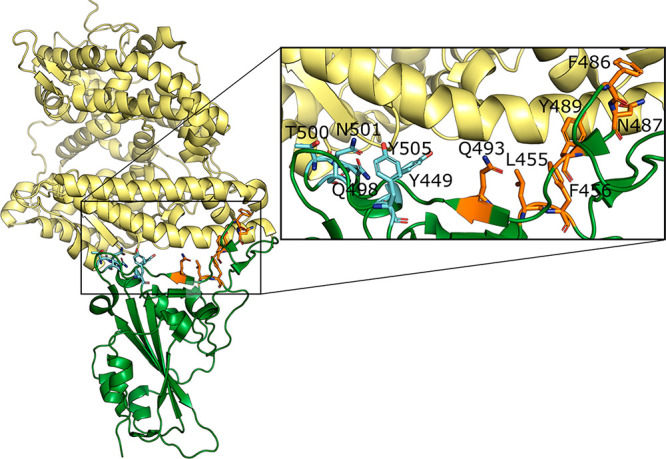
Complex between hACE2 (yellow) and SARS-CoV-2 RBD (green) from the X-ray structure (PDB code 6M0J). The hot spot residues are represented in sticks and labeled in the inset. Hot spots of cluster 1 are represented in orange, while those of cluster 2 are represented in cyan.