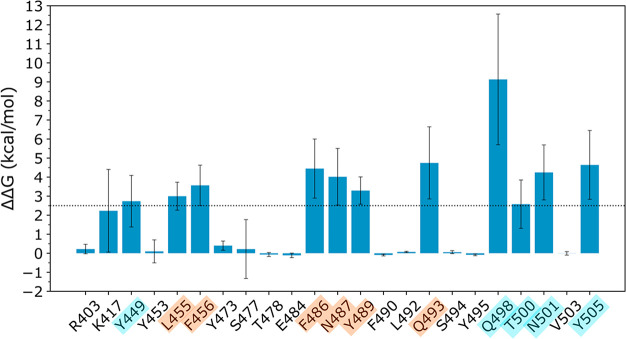
Figure 3.
Difference in the binding free energy between the mutated system and the native one computed on the last 10 ns of the MD simulation of the hACE2-RBD complex. All the residues for which the ΔΔG is greater than the threshold (2.5 kcal/mol) have been considered as hot spots. The hot spots of cluster 1 are highlighted in orange and those of cluster 2 in cyan.

