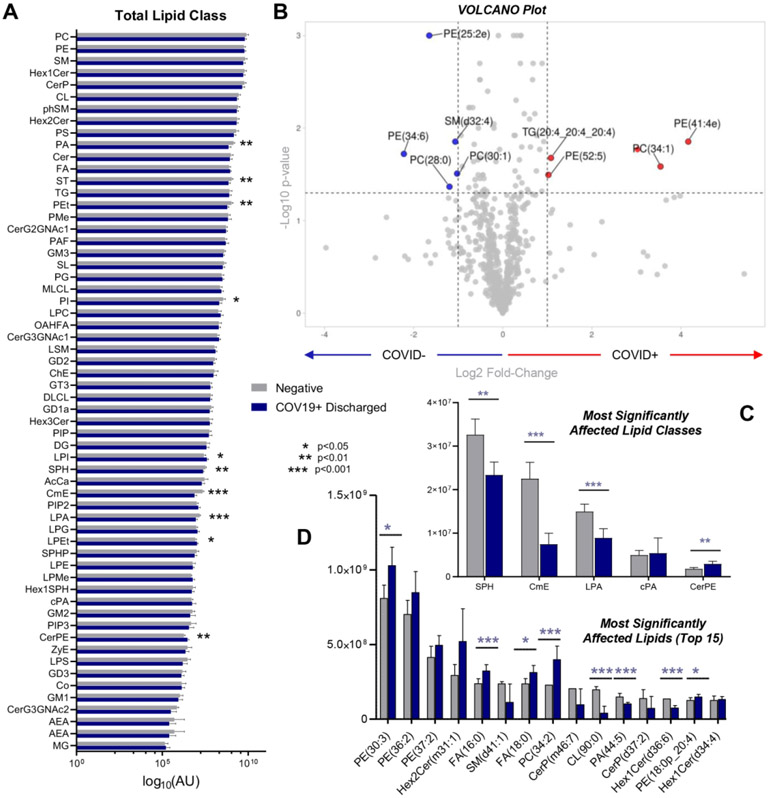
Figure 7 – Lipidomics analyses of RBCs from COVID-19-positive and control patients.
(A) An overview of all the lipid classes investigated in this study (log10 normalized areas) and their variation across groups (symbols indicating significance by t-test are reported in the legend in the center of the panel). (B) Volcano plot showing the most significantly affected lipids, comparing COVID-19-positive subjects and controls. (C and D) Expanded view of the top lipid classes and lipids, respectively, affected by COVID-19. Asterisks indicate significance by t-test (* p<0.05; ** p<0.01; *** p<0.001). Groups are color coded according to the legend in the center of the figure.

