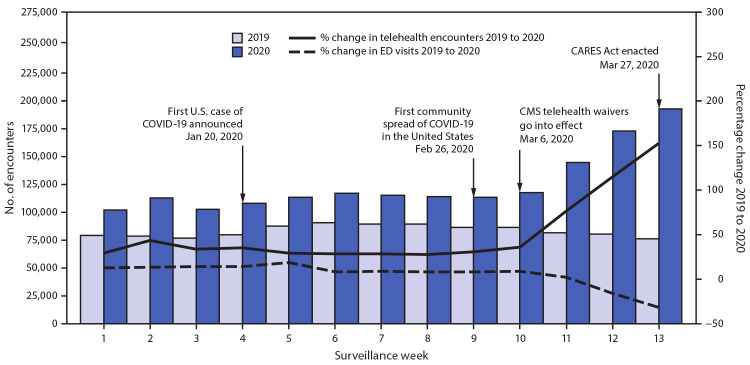
FIGURE 1.
Number of telehealth patient encounters reported by four telehealth providers that offer services in all states and percentage change in telehealth encounters and emergency department (ED) visits — United States, January 1–March 30, 2019 (comparison period) and January 1–March 28, 2020 (early pandemic period)*
Abbreviations: CARES Act = Coronavirus Aid, Relief, and Economic Security Act; CMS = Center for Medicare & Medicaid Services; COVID-19 = coronavirus disease 2019.
* Unpublished ED visit data obtained from the National Syndromic Surveillance Program.

