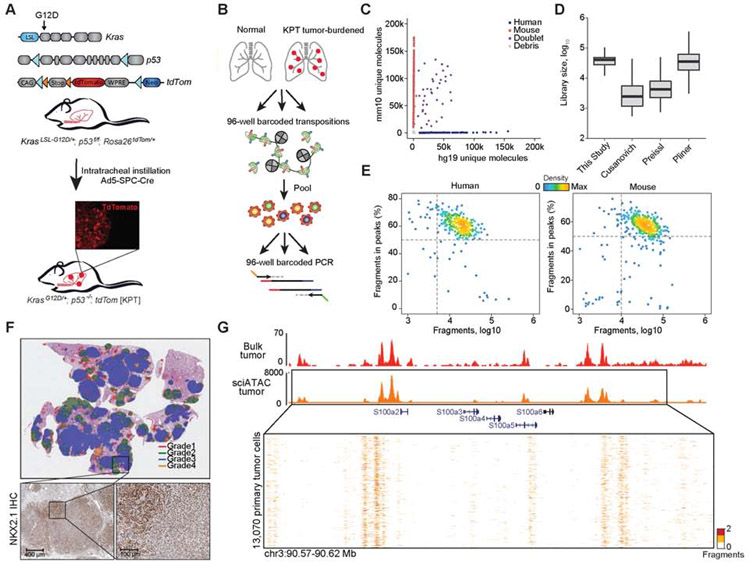
Figure 1. An optimized single-cell ATAC-seq approach enabled analyses of single KP tumor cells.
(A) Schematic of alleles in the KPT model, LSL: lox-stop-lox; loxp (blue arrows); FRT site (orange arrows). Inset immunofluorescence (IF) image of a tdTom positive (tdTom+) tumor. (B) Schematic of sciATAC-seq strategy for single-cell profiling of tdTom+ cancer cells. (C) Unique fragments from species-mixing experiment of GM12878 (n = 1) and 3T3 cells (n = 1). (D) Estimated library sizes of published data (Cusanovich et al., 2015; Pliner et al., 2018; Preissl et al., 2018) and this study, derived from GM12878 cells. Box intervals represent 25% and 75% bounds. (E) FRIP by total fragments recovered from GM12878 and 3T3 cells. (F) IHC of a tumor-burdened lung at 30 weeks after tumor initiation in KPT model, representing H&E with Aiforia defined grades (top) and NKX2.1 IHC (scale bar; bottom, left 400 μm and right 100 μm). (G) Chromatin accessibility tracks generated from bulk ATAC-seq of a KPT tumor (red) (n = 1) and aggregated single-cell from a primary KPT tumor (n = 13,070; orange) at the S100 gene family locus. see also Fig. S1 and Table S1.

