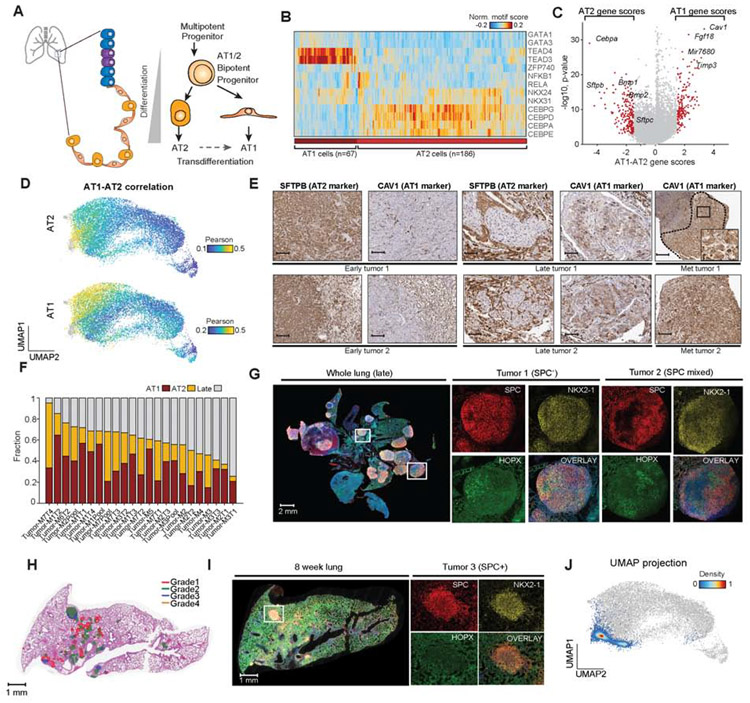
Figure 3. KPT cancer cells reflected AT1 and AT2 epigenomic states.
(A) Schematic of epithelial cell types and alveolar differentiation hierarchy. (B) Hierarchical clustering of AT1 (n = 67) and AT2 (n = 186) cells based on top significant TF motif scores, labeled by AT1 and AT2 cluster identity (bottom). (C) Volcano plot of differential gene scores between AT1 versus AT2 cells. Genes with a differential gene score greater than 1.8 or less than −1.8 are highlighted in red with −log10 p value shown. (D) Correlation of each cancer cell to normal AT1 and AT2 cells using gene score signatures. Cells are colored by their Pearson r differential correlation coefficients. (E) Images of serial sections of early KP tumors (n = 2), late KP tumors (n = 2), and lymph node metastases (n = 2) stained for SFTPB (AT2 marker) and CAV1 (AT1 marker) (scale bar, 250 μm except Met tumor 2 125 μm; inset, 50 μm). (F) Fraction of single cancer cells per sample that resemble AT1-like, AT2-like or late-stage cells; red=AT1, orange=AT2 and gray=late (n = 23). (G) Multiplexed IHC in a late-stage tumor sample; whole lung and two individual tumors shown; red (SPC; AT2), yellow (NKX2-1), green (HOPX; AT1), and overlay with DAPI (scale bar; whole lung, 0.5x, 2000 μm; tumor 1; 7.5x, 200 μm; tumor 2; 4.5x, 200 μm). (H) Aiforia graded 8-week tumor-burdened lung (red=grade 1, green=grade 2, blue=grade 3, and orange=grade 4). (I) Multiplexed IHC staining of an exemplar lung lobe at 8 weeks post-initiation stained with SPC (red), NKX2-1 (yellow), HOPX (green) and overlaid channels with DAPI. tdTom+ cells from entire lung used for scATAC-seq profiling (scale bar; whole lung, 0.7x, 1000 μm; tumors; 10x, 100 μm). (J) scATAC-seq profiling and projection of early time point (ETP) cells (n = 4,610) onto the original UMAP clustering of all lung cells (gray points). ETP cells are colored by cluster density. see also Fig. S3 and Table S2.

