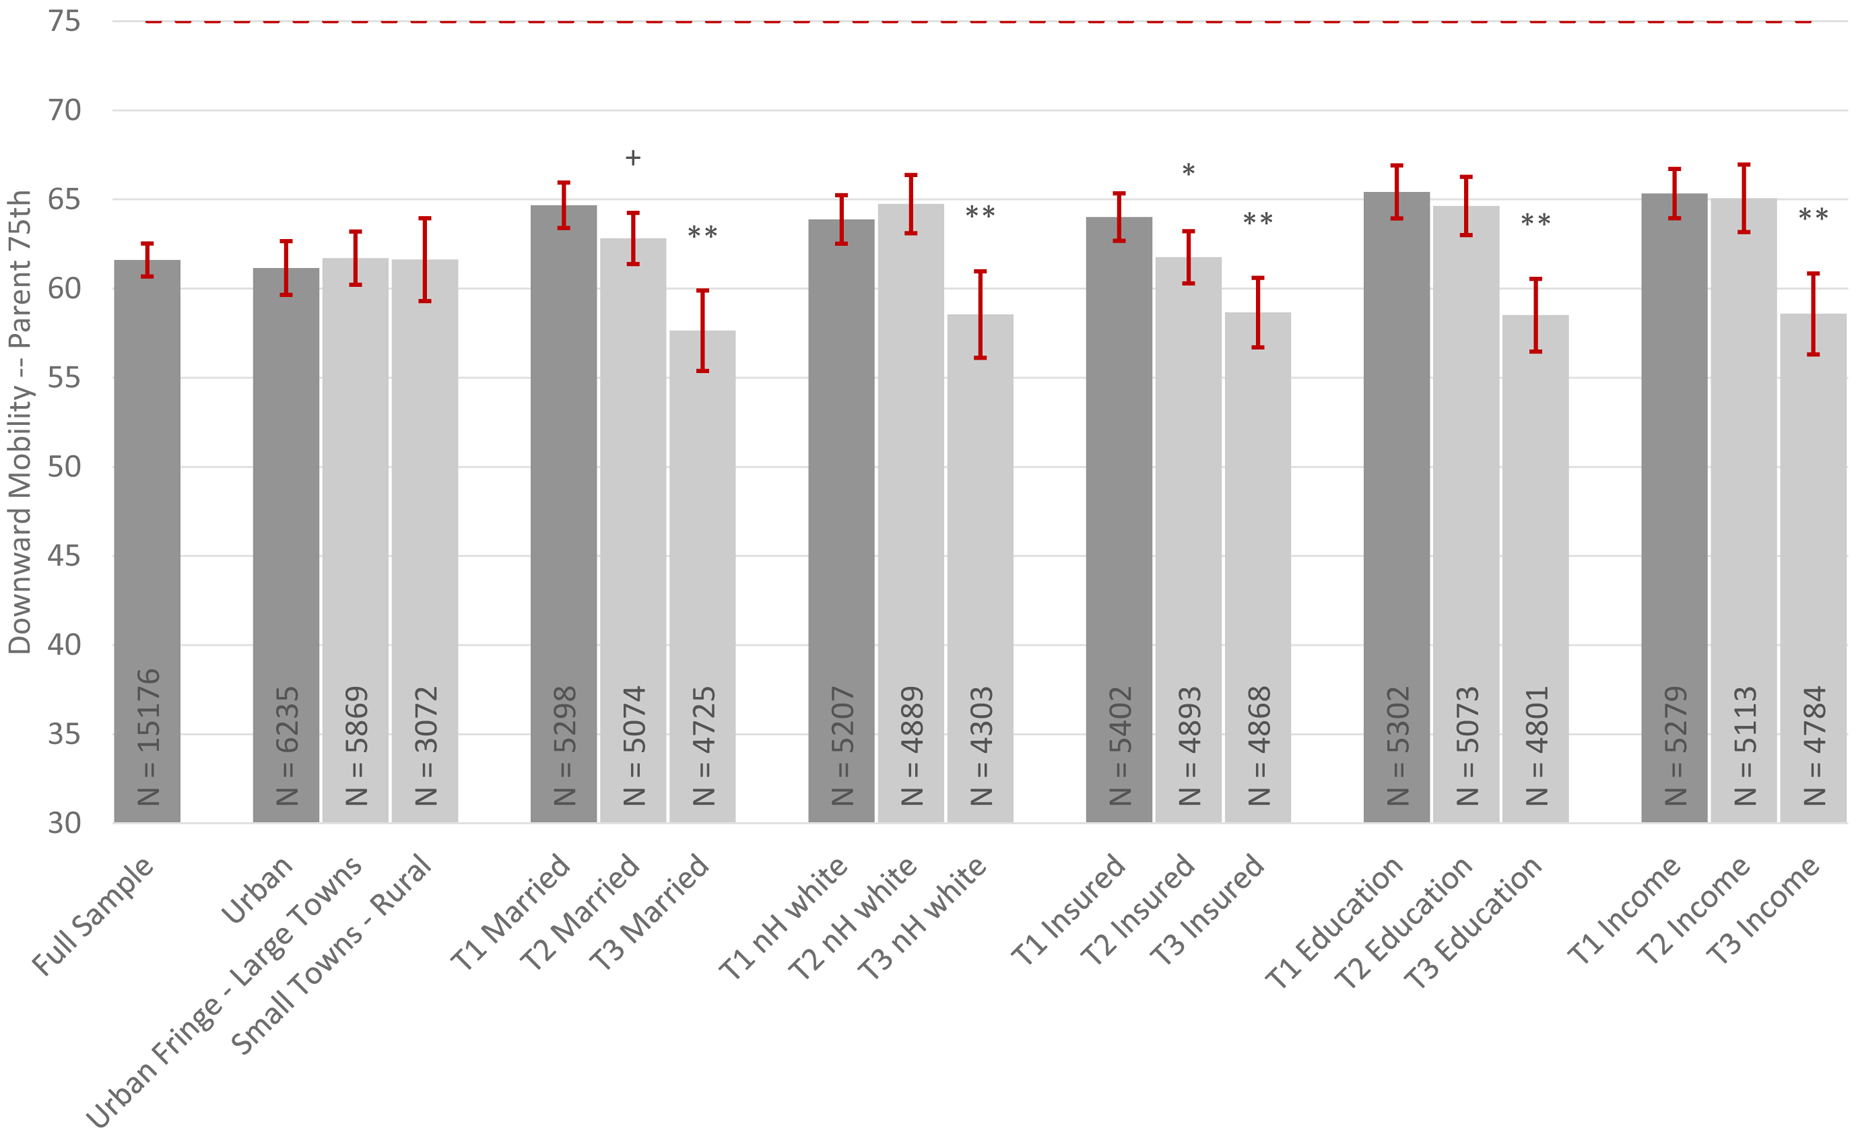
Exhibit 4: Figure.

Caption: Community Variation in Downward Health Mobility
Source: Authors’ calculations using ECLS-K data.
Notes: Notes from Exhibit 2 apply. T represents the tercile of a particular characteristic with the reference being the top tercile. Married refers to the portion of married parents; nH white refers to the portion of non-Hispanic white children; Insurance refers to the portion of children with health insurance in Kindergarten; Education refers to the parent(s)’ highest educational attainment, and Income refers to the moving average of parent income from Kindergarten to 8th grade. Cut-off values for each tercile in Appendix Table A5.2 (25). Models additionally control for individual characteristics that are related to the community partition. Dashed lines represent mobility reference point. p < 0.1 +, p < 0.5 *, p < 0.1 **.
