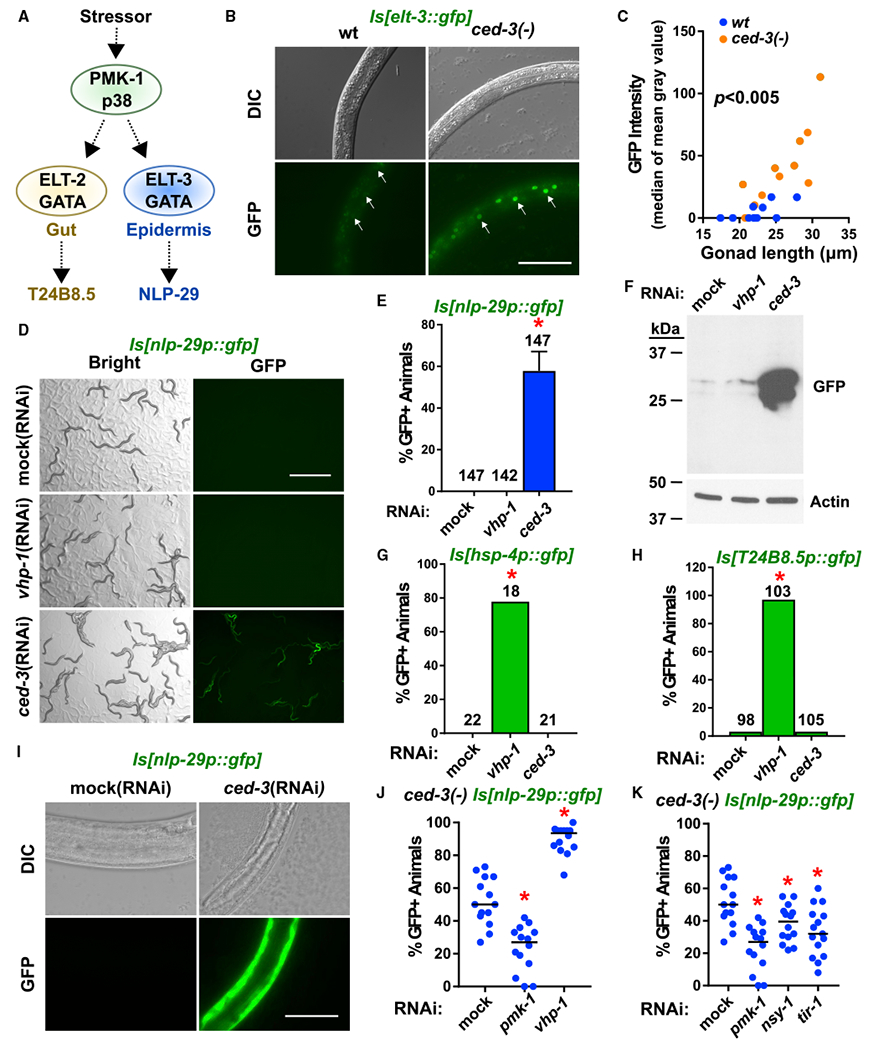
Figure 2. CED-3 Caspase Limits Expression of a p38-Dependent Anti-Microbial Peptide in the Epidermis.

(A) Diagram of the stress-responsive p38 MAPK pathway and tissue-specific GATA transcription factors and transcriptional targets. Dashed arrows indicate downstream targets.
(B and C) Pseudo-colored images (B) and quantitation (C) of upregulation of the p38-dependent epidermal-specific GATA transcription factor ELT-3 in the ced-3(−) background (see also Figure S2A for western blot analyses of ELT-3 and ELT-2). Arrows indicate epidermal nuclei. Scale bar, 50 μm. The median of mean gray values is plotted as a function of gonad length to account for fine differences in developmental stage. Dots indicate individual animals. The ced-3(−) strain had significant upregulation compared to wt, p < 0.005, Mann-Whitney. Also see Figure S2B for suppression tests with pmk-1 and elt-3 mutants.
(D and E) Pseudo-colored images (D) and quantitation (E) of ced-3(RNAi) induction of nlp-29p::gfp expression. GFP protein expressed from a transgene with nlp-29 promoter and 5′ UTR is induced by ced-3(RNAi), but not by vhp-1(RNAi). Scale bar, 1 mm. Percentage of animals expressing GFP with standard deviation is shown with total number of animals scored for each condition. *Significant, mock (RNAi) versus ced-3(RNAi), p < 0.0001, Fisher’s exact test. Standard deviation shown.
(F) nlp-29p::gfp expression was confirmed by western blot. For additional lanes on right side, see Figure S2C for confirmation of comparable GFP induction by ced-3(−) null mutation with same exposure time and see Figure S2D for confirmation of GFP fluorescence by ced-3(n2433) caspase active site mutation.
(G and H) Intestinal reporters show upregulation by vhp-1(RNAi) but not by ced-3(RNAi). The number of GFP positive animals from the hsp-4p::GFP (G) and T24B8.5p::GFP (H) transgenes were scored in the blind. L4 larvae were put on the indicated RNAi plates and their L4 or young adult stage offspring were examined. *Significant for vhp-1(RNAi) versus either mock (RNAi) or ced-3(RNAi), p < 0.0001, Fisher’s exact test.
(I) Pseudo-colored GFP fluorescence and DIC microscopy show GFP expression caused by ced-3(RNAi) is visible only in the epidermis. L4 animals were put on the indicated RNA is and their L4 or young adult stage offspring were examined. Magnification was the same throughout (scale bar indicates 50 μm). Exposure time was the same throughout for GFP fluorescence (150 ms).
(J) Induction of nlp-29p::GFP in ced-3(−) mutants was blocked by pmk-1 (RNAi) and enhanced by vhp-1(RNAi). *Significant, mock (RNAi) versus pmk-1 (RNAi) and vhp-1(RNAi), p < 0.001, Mann-Whitney. Each dot represents a plate. Median values (thin horizontal bars).
(K) Confirmation that upregulation of nlp-29p::GFP expression by ced-3(−) mutation requires known factors upstream of PMK-1 in p38 epidermal pathway. All phenotypes were scored three times in the blind. *Significant, mock (RNAi) versus pmk-1(RNAi), nsy-1(RNAi), and tir-1(RNAi), p < 0.05, Mann-Whitney.
