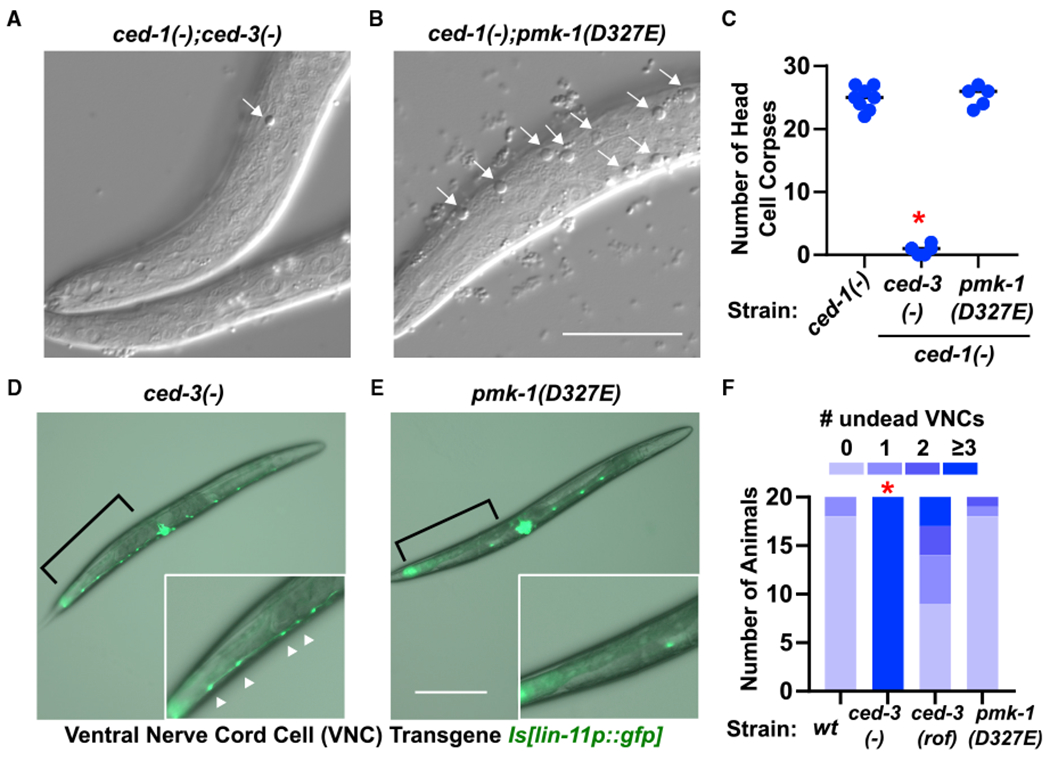
Figure 5. Caspase-Cleavage-Resistant p38 MAPK Does Not Impact CED-3-Dependent Programmed Cell Death in Early or Late Larval Development.

(A–C) Early first larval stage animals using ced-1(e1735) background to visualize head cell corpses of ced-3-dependent cells fated to die. The ced-3(−) (A) and pmk-1(D327E) (B) effects on accumulation of head corpses were evaluated. Representative images of a given focal plane fo rthe indicated genotypes with head corpses (arrows) from cells fated to die being engulfed by neighboring cell. Scale bar, 20 μm. (C) Total cell corpses found in heads of first larval stage animals. *Significant, ced-3(−) versus wt, p < 0.001, Mann-Whitney.
(D–F) First day adults using lin-11p::GFP to visualize undead ventral nerve cord cells (VNCs). The ced-3(−) (D) and pmk-1(D327E) (E) effects on undead VNCs were evaluated. Representative images of the indicated genotypes with area of P9-12 dead (no GFP) or undead VNCs (bright GFP) (brackets). Pseudo-colored GFP and transmitted light were over laid in each image to indicate anatomical position. Insets are digital zoom of the area indicated by brackets. Scale bar, 200 μm. (F) Summary of animals with indicated number of undead P9-12 cells by counting lin-11p::GFP positive VNCs. *Significant, ced-3(−) versus wt, p < 0.001, Fisher’s exact test.
