Figure 1.
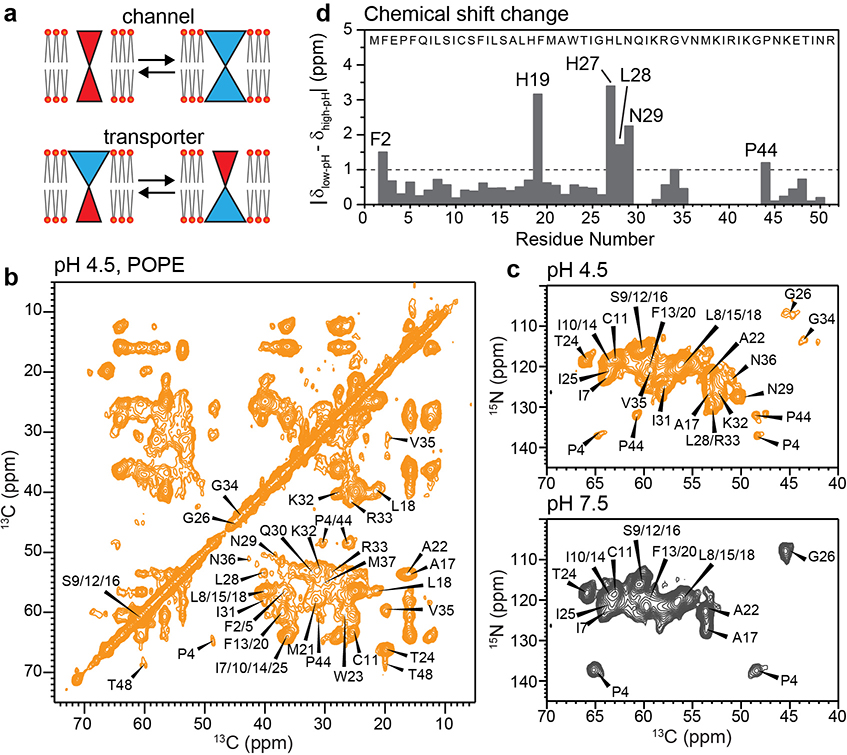
2D correlation solid-state NMR spectra indicate an α-helical TM domain for membrane-bound BM2. (a) Schematic of the key differences between ion channels and transporters. Open channels have a pore that is accessible to both sides of the lipid bilayer, whereas transporters are alternatingly accessible to one and the other side of the membrane. (b) 2D 13C-13C correlation spectrum of POPE-membrane bound BM2 at pH 4.5, measured at Tsample = 280 K. (c) 2D 15N-13Cα correlation spectrum of POPE-bound BM2 at pH 4.5 (orange) and pH 7.5 (grey), measured at Tsample = 290 K. (d) Residue-specific chemical shift differences between low and high pH. Most TM residues show negligible chemical shift changes, except for H19 and H27, which change their protonation states due to the pH change.

