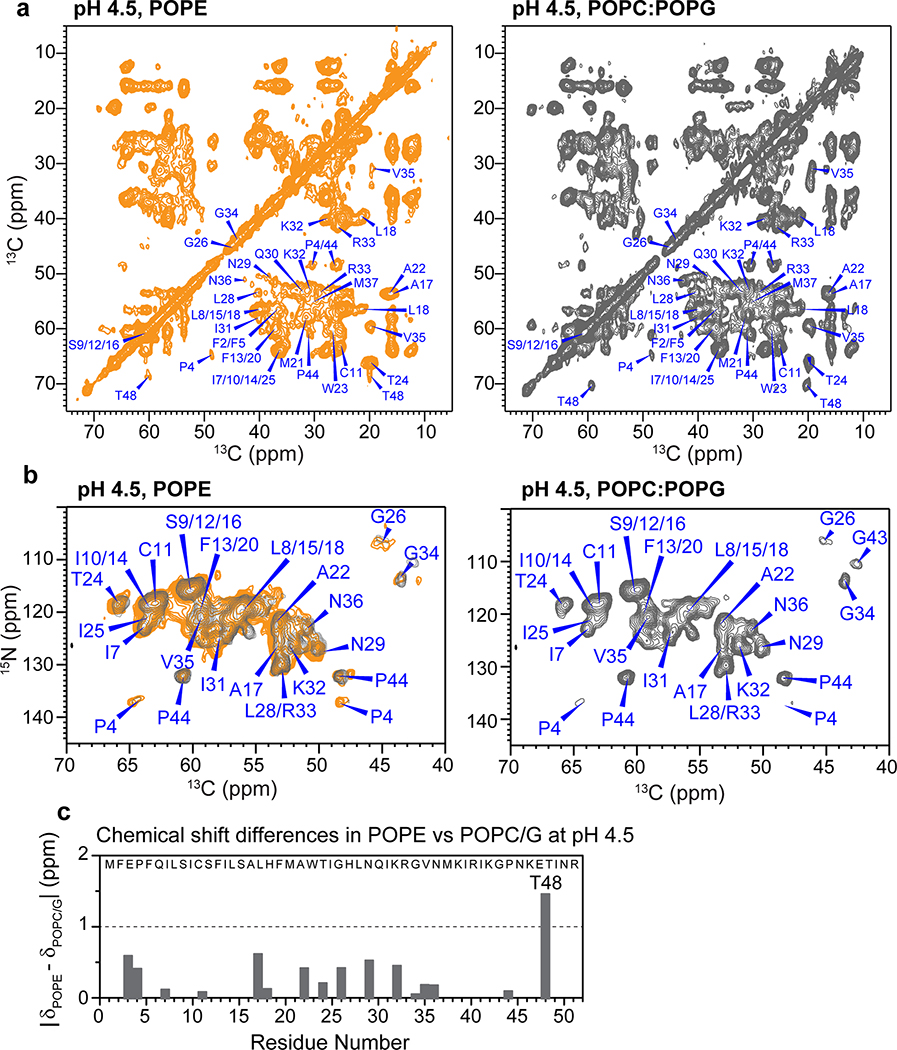
Extended Data Fig. 5. BM2 has similar conformations in POPE and POPC:POPG bilayers.
(a) 2D 13C-13C CORD spectra of BM2 in the two lipid membranes at low pH. (b) 2D 15N-13C correlation spectra of BM2 in the two lipid membranes at low pH. The POPE sample was measured at Tsample = 290 K for the 2D NC spectrum and 280 K for the 2D CC spectrum, while the POPC : POPG sample was measured at Tsample = 270 K to account for the lower phase transition temperature of this membrane. The lipid bilayers of both samples were in the gel phase, as assessed by 1H spectra of the sample. Both spectra were measured under 14 kHz MAS on an 800 MHz spectrometer. (c) Chemical shift differences between the POPE and POPC:POPG samples at low pH. Residues in the α-helical TM domain and the β-strand do not show significant chemical shift differences.

