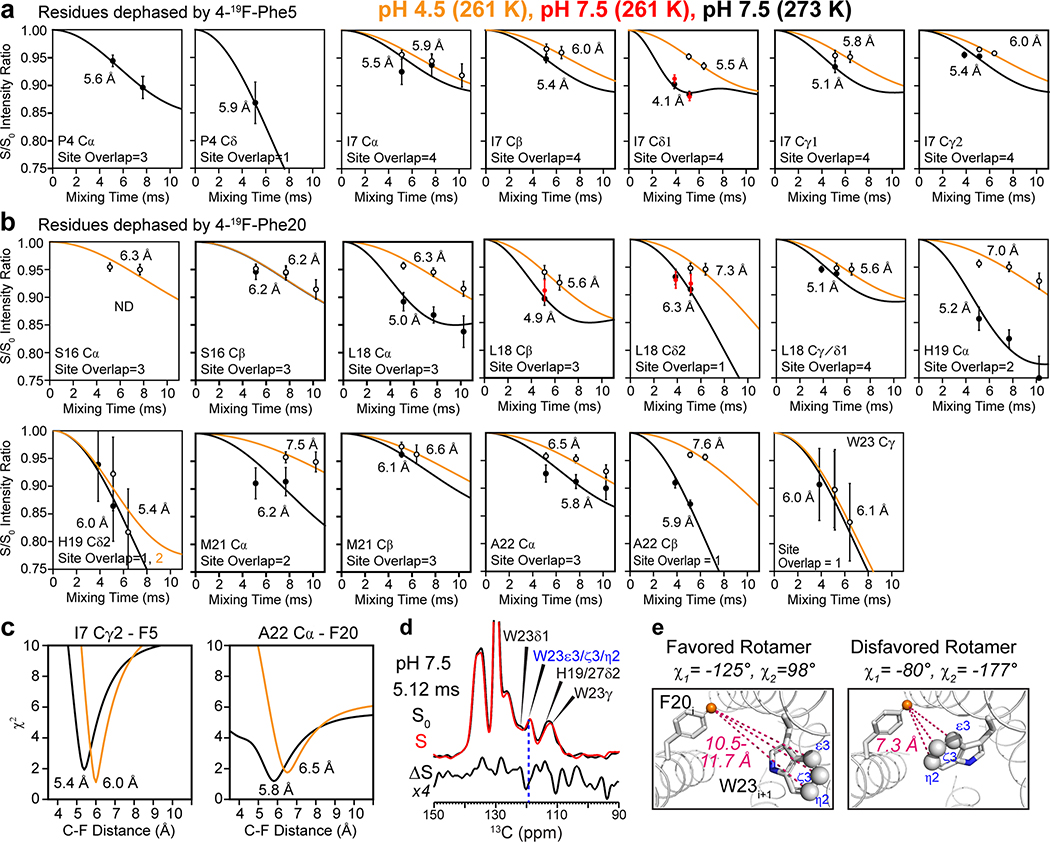
Extended Data Fig. 7. 13C-19F REDOR data for measuring interhelical distances of BM2 at high pH (black curves and filled symbols) and low pH (orange curves and open symbols).
The high pH data were measured at a sample temperature (Tsample) of 273 K, while the low pH data were measured at 261 K. Additional high-pH data measured at Tsample = 261 K (red symbols in some of the panels) are indistinguishable from 273 K data, confirming that the protein is immobilized at both temperatures. (a) N-terminal residues that are dephased by 4F-Phe5. (b) C-terminal residues whose dephasing is attributed to 4F-Phe20. All sites show less dephasing for the low-pH sample than the high-pH sample, indicating longer distances for the open channel. P4 has negligible dephasing at low pH. (c) Representative χ2 as a function of 13C-19F distance, showing the extraction of the best-fit distances and uncertainties. (d) Aromatic region of representative 13C-19F REDOR spectra of BM2 at high pH. The difference spectrum (ΔS) shows no dephasing for the 119-ppm W23 Cε3/ζ3/η2 peak (blue dashed line), indicating that 4F-Phe20 of the neighboring helix is far from these indole carbons. This is consistent with a W23 rotamer of t90 (χ1 = -125°, χ2 = 98°) but inconsistent with the mt rotamer (χ1=−80°, χ2=−177°).

