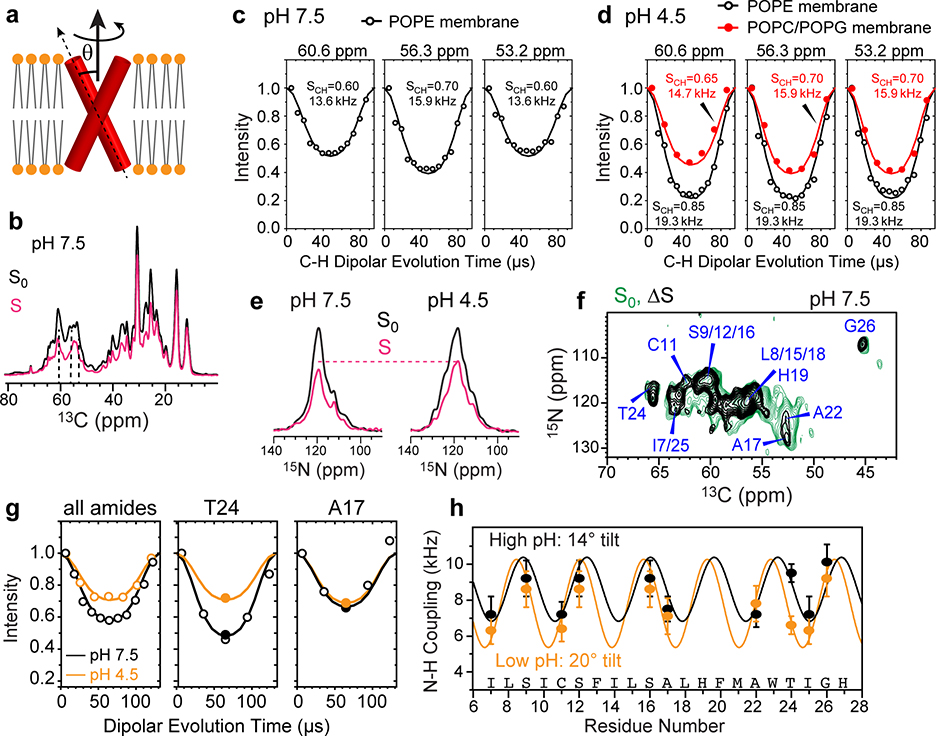
Figure 2.
Determination of the helix orientation of BM2 in the closed (high pH) and open (low pH) states. (a) Schematic of orientation measurement using rotationally averaged N-H dipolar couplings. (b) Representative 13C cross sections of the 2D 13C-1H DIPSHIFT spectra of POPE-bound BM2 at high pH. The S0 and S spectra were extracted from cross sections with dipolar evolution times of 0 μs and 41 μs. The spectra were measured at Tsample = 315 K under 10.5 kHz MAS. (c) 13C-1H DIPSHIFT curves of the POPE-bound BM2 at pH 7.5. Order parameters of 0.6–0.7 are observed for Cα sites, consistent with whole-body motion. (d) 13C-1H DIPSHIFT curves of BM2 at pH 4.5. The POPE-bound protein shows high order parameters, indicating immobilization, whereas the POPC : POPG-bound protein shows low order parameters of 0.65–0.70, consistent with whole-body motion. (e) Full (S0) and dipolar-dephased (S) 15N spectra of membrane-bound BM2. The protein shows higher S/S0 ratios at low pH than at high pH, indicating weaker N-H dipolar couplings. The spectra were measured under 7.6 kHz MAS at Tsample = 315 K at high pH and 313 K at low pH. (f) Control (S0) and difference (ΔS) 2D 15N-13C spectrum of membrane-bound BM2 at pH 7.5. The difference spectrum was obtained by subtracting a 57-μs N-H dephased spectrum from the control spectrum. Higher difference intensities indicate larger N-H dipolar couplings. (g) N-H DIPSHIFT curves for all amide groups obtained from 1D 15N spectra and for two residues resolved in the 2D 15N-13C spectra. The dipolar dephasing is weaker at low pH than at high pH. (h) Residue-specific N-H dipolar couplings at high pH (black) and low pH (orange). The couplings are best fit to dipolar waves for helix tilt angles of 14° and 20°, respectively.

