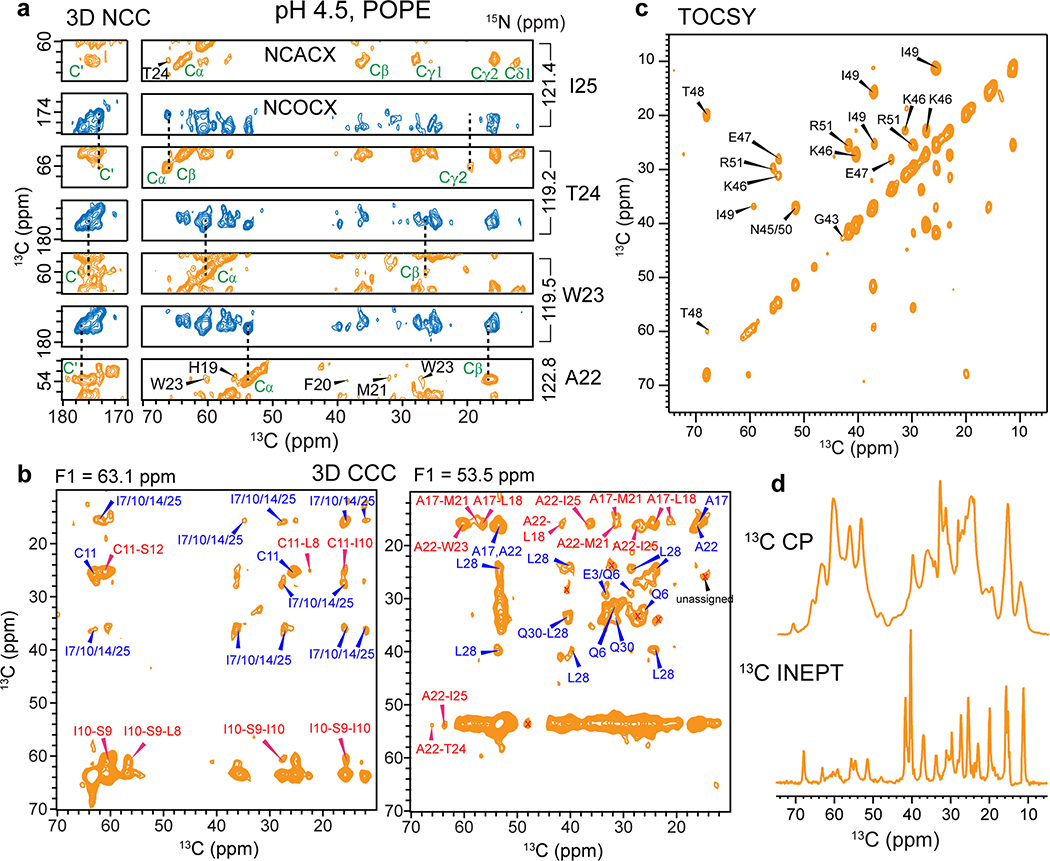
Extended Data Fig. 2. Resonance assignment and inter-residue correlations of membrane-bound BM2 at pH 4.5.
(a) Representative strips of the NCACX (orange) and NCOCX (blue) regions of the 3D NCC spectrum to obtain sequential resonance assignment. The spectrum was measured at Tsample = 280 K. (b) Representative F2-F3 planes of the 3D CCC spectrum, showing various inter-residue correlations (assigned in red) that restrain the structure. The spectrum was measured using spin diffusion mixing times of 41 ms and 274 ms, at Tsample = 280 K. (c) 2D 13C-13C TOCSY spectrum with 7.7 ms mixing, collected at Tsample = 290 K. Residues 43–51 are dynamic and exhibit chemical shifts indicative of random coil conformation. (d) 1D 13C cross-polarization (CP) spectrum preferentially detects immobilized residues while the 13C INEPT spectrum preferentially detects highly dynamic residues. These 1D spectra were measured at Tsample = 280 K.

