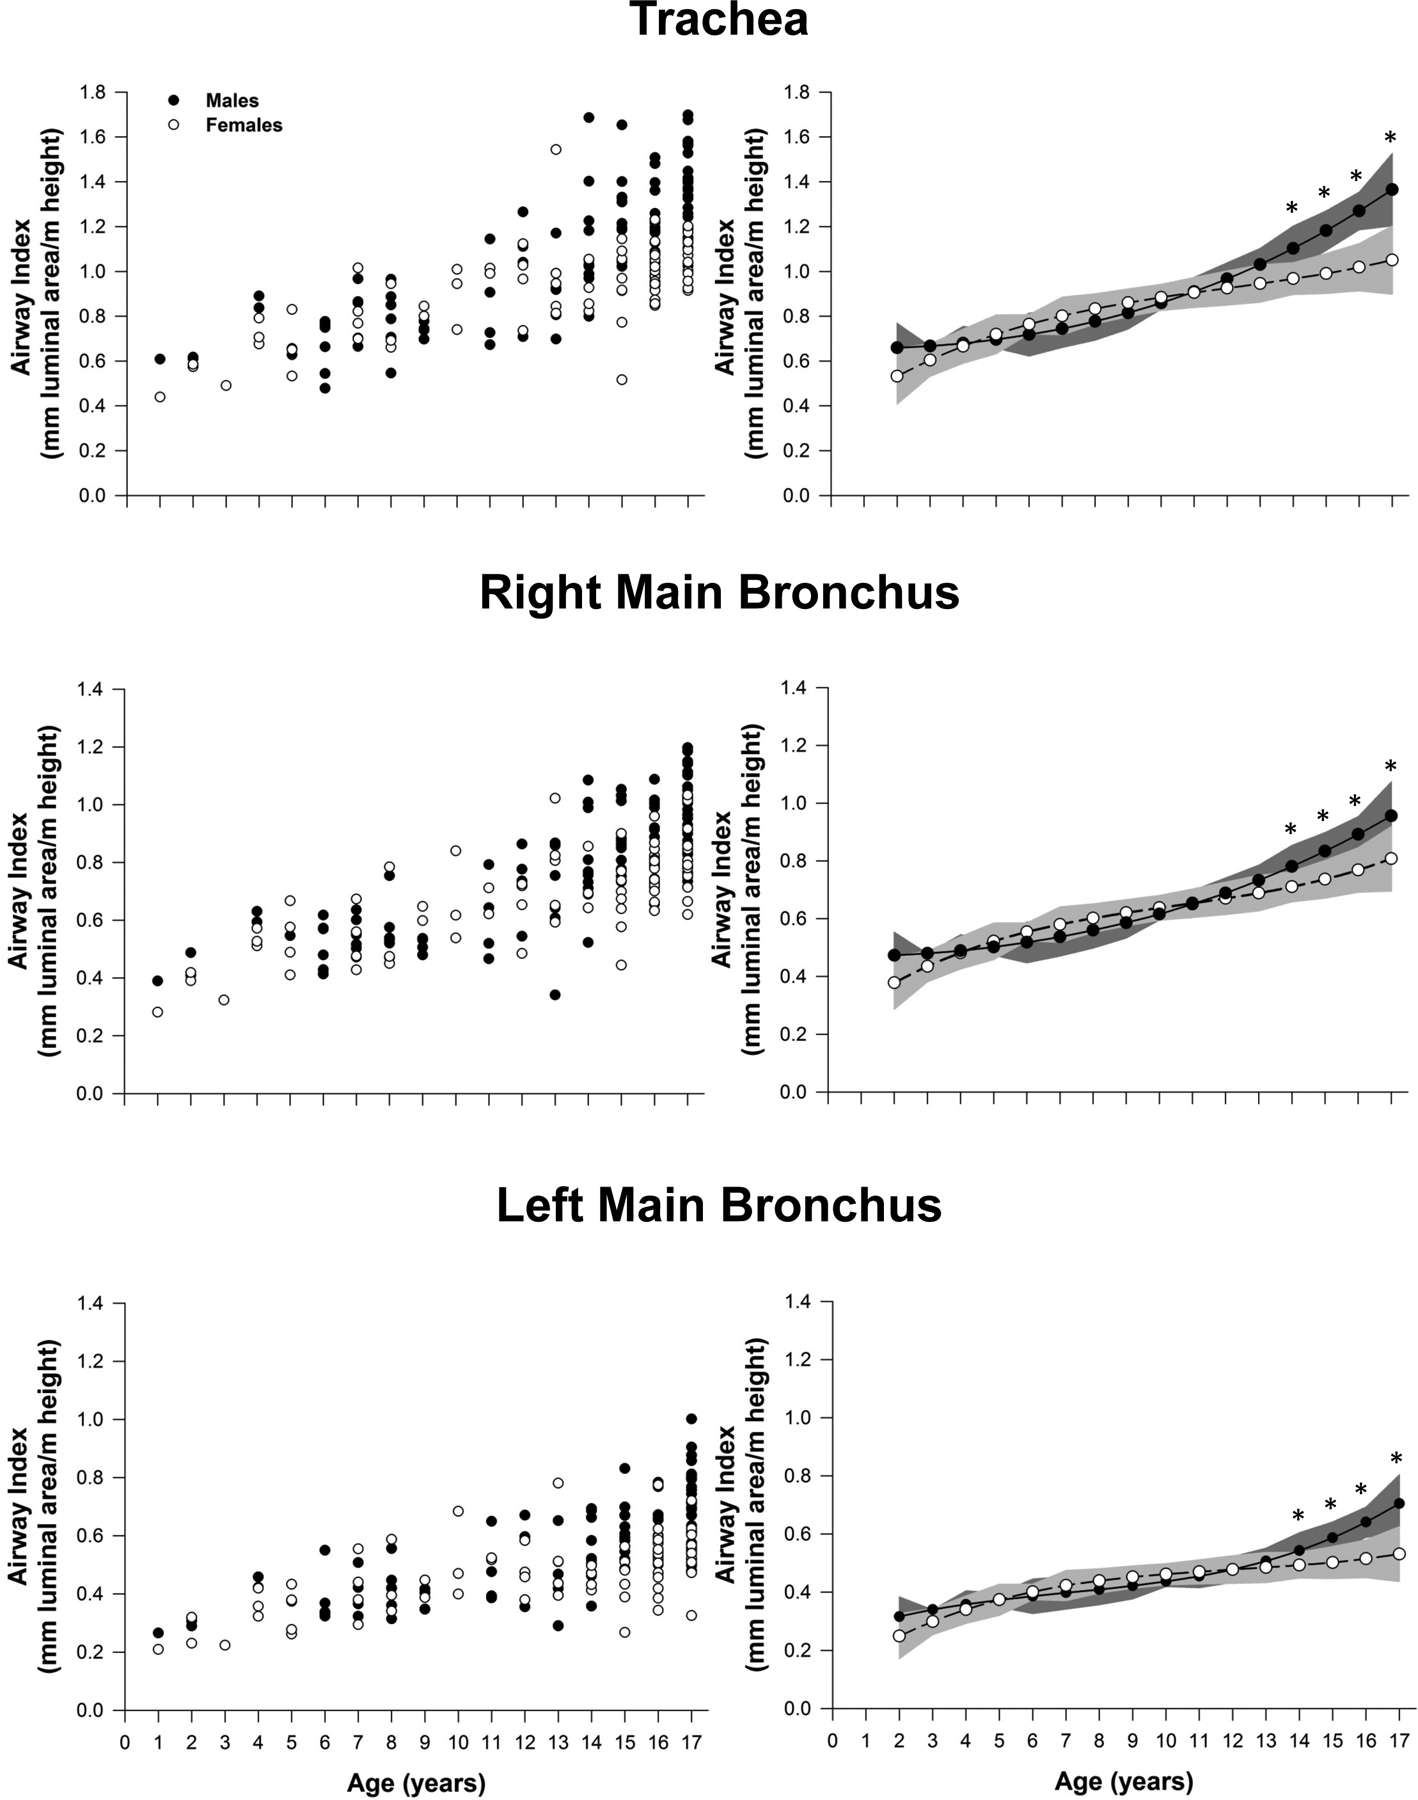
Figure 4.

Airway size adjusted for height for the trachea along with right and left main bronchus. Leftmost panels represent the raw values for each patient. Panels on the right are model based means based on a polynomic model fit with two degrees. The shaded area on the right panels represents the confidence bands for the estimated means. Significantly different between sexes: *, P<0.05.
